صفحه اصلی تقویم اقتصادی تحلیل رمزارزها (Cryptocurrency) تحلیل طلا (Gold) تحلیل فارکس (Forex) ارتباط با من درباره من
سایت تحلیل بورس، فارکس و ارز دیجیتال حمید راحت حق| Rahathagh.ir

اخبار و تحلیل نموداری و تکنیکالی بازارهای مالی دنیا اعم از بازار بورس داخلی، بازار فارکس، بازار طلا و بازار ارز دیجیتال و رمزارزها و روانشناسی بازار

Silver Technical Analysis (XAG) Thursday, February 11
Silver Technical Analysis (XAG) Thursday, February 11

https://bayanbox.ir/view/3561361682016821299/stack-of-silver-%D8%B1%D8%A7%D8%AD%D8%AA-%D8%AD%D9%82.jpg
After hitting a high of $ 27.81 at the beginning of the week, the price of silver is experiencing a volatile trend in the range of $ 26.82.
This price correction was accompanied by the formation of a candle pattern with long shadows and is a sign of buyers' reluctance to act. Thus, there is a possibility of further fall in the price of silver.
The first support level is at $ 25.90, the weekly price floor. If the price penetrates below this level, the next target will be $ 24.60 support.
On the other hand, this week's price ceiling of $ 27.81 plays the role of a resistance for buyers.
Technical levels
Last price of the day: $ 26.82
Daytime fluctuations: 0.19-
Daytime fluctuations (٪): -0.70
Starting price: $ 27.01
Trends
20-day moving average: $ 26.2
50-day moving average: $ 25.79
100-day moving average: $ 24.92
200-day moving average: $ 23.28
Levels
Yesterday's highest price: $ 27.53
Yesterday's lowest price: $ 26.82
Last week's highest price: $ 30.07
Last week's lowest price: $ 25.9
Last month's highest price: $ 27.92
Last month's lowest price: $ 24.19
Fibonacci 38.2. Daily: $ 27.09
Fibonacci 61.8. Daily: $ 27.26
Pivot S1 Daily: $ 26.71
Pivot S2 Daily: $ 26.41
Pivot S3 daily: $ 26
Pivot R1 Daily: $ 27.42
Pivot R2 Daily: $ 27.83
Pivot R3 Daily: $ 28.13
۲۳ بهمن ۹۹ ، ۱۰:۴۶
حمید راحت حق

EURUSD Thursday, February 11

EURUSD Thursday, February 11

https://bayanbox.ir/view/8279395159996211685/Everything-about-EUR-USD-%D8%B1%D8%A7%D8%AD%D8%AA-%D8%AD%D9%82.jpg
In the EURUSD weekly chart, the market is still bullish, hovering above the key support of $ 1.50. This support can be seen in the EURUSD daily and weekly charts. The $ 1.50 support is also in line with the 50% Fibonacci correction and the daily support trend line. However, the uptrend of the euro against the US dollar seems to be limited, especially since the daily resistance is seen at $ 1.2165.
In the EURUSD four-hour chart, the market is under selling pressure from the resistance of $ 1.2165. This resistance could be a good place to enter a sell trade and lower the euro to the $ 1.2067 support area.

۲۳ بهمن ۹۹ ، ۱۰:۳۶
حمید راحت حق

GBPUSD Thursday, February 11

GBPUSD Thursday, February 11

https://bayanbox.ir/view/2224469749292481162/gbpusd11-2%D8%B1%D8%A7%D8%AD%D8%AA-%D8%AD%D9%82.jpg
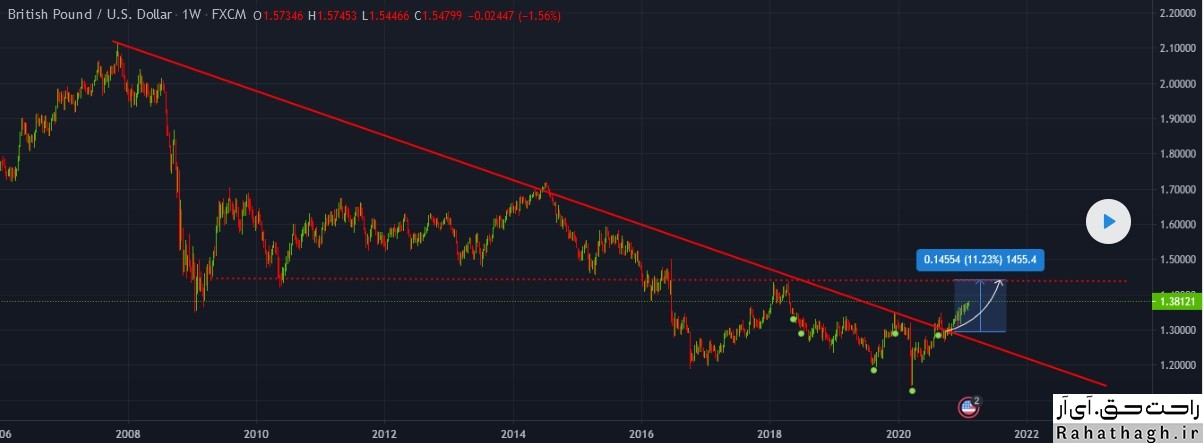
In the GBPUSD weekly chart, the market is still fluctuating between the weekly support of $ 1,3503 and the weekly resistance of $ 1,3847. According to the daily chart, the pound is approaching the resistance of $ 1.3847. Meanwhile, GBPUSD weekly and daily charts show no further support up to $ 1,3503. In the GBPUSD four-hour chart, the pound is bearish and the pound is engaged in short-term resistance at $ 1.3847. This key resistor also matches well with the weekly resistors. For this reason, it can be a good place to enter into a sales deal. If a bearish return from this range occurs, the pound could move to the support of 1.3752.

۲۳ بهمن ۹۹ ، ۱۰:۲۷
حمید راحت حق

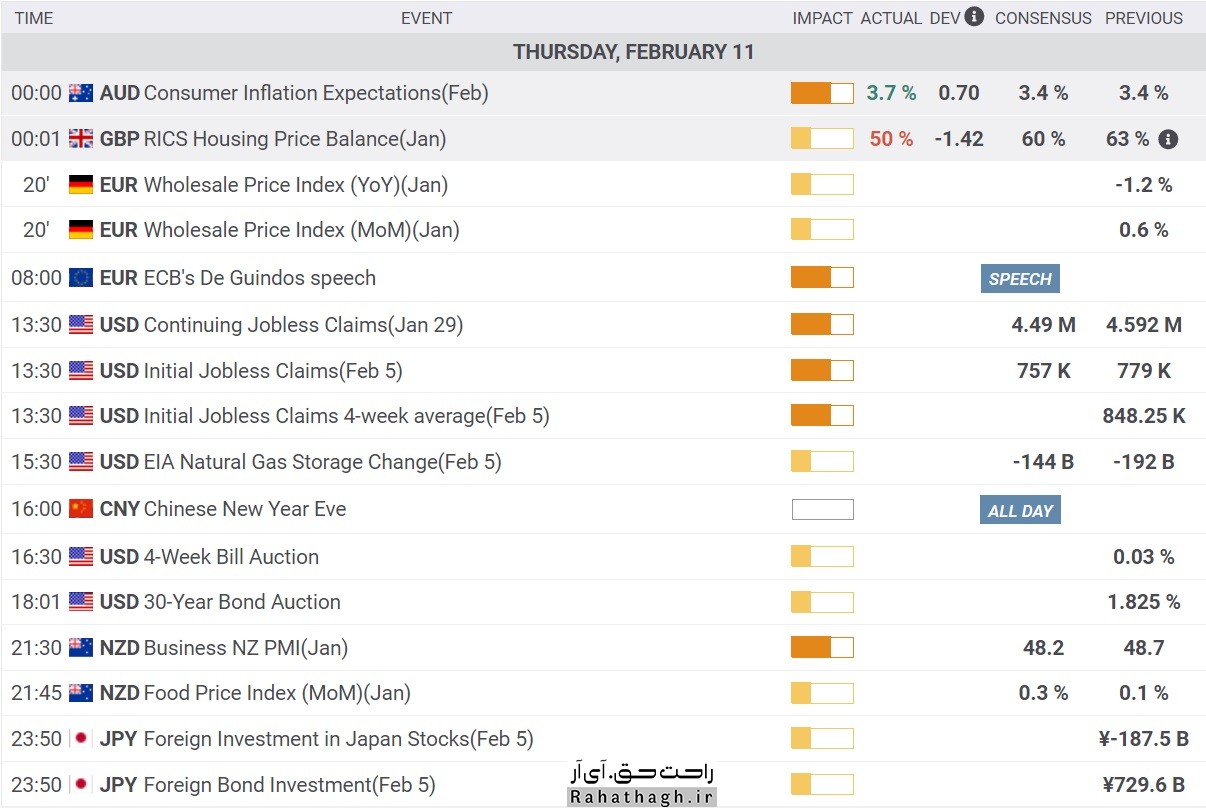
Economic calendar Thursday, February 11

Economic calendar Thursday, February 11

https://bayanbox.ir/view/2646282681375414877/eco11-2%D8%B1%D8%A7%D8%AD%D8%AA-%D8%AD%D9%82.jpg

۲۳ بهمن ۹۹ ، ۱۰:۱۶
حمید راحت حق

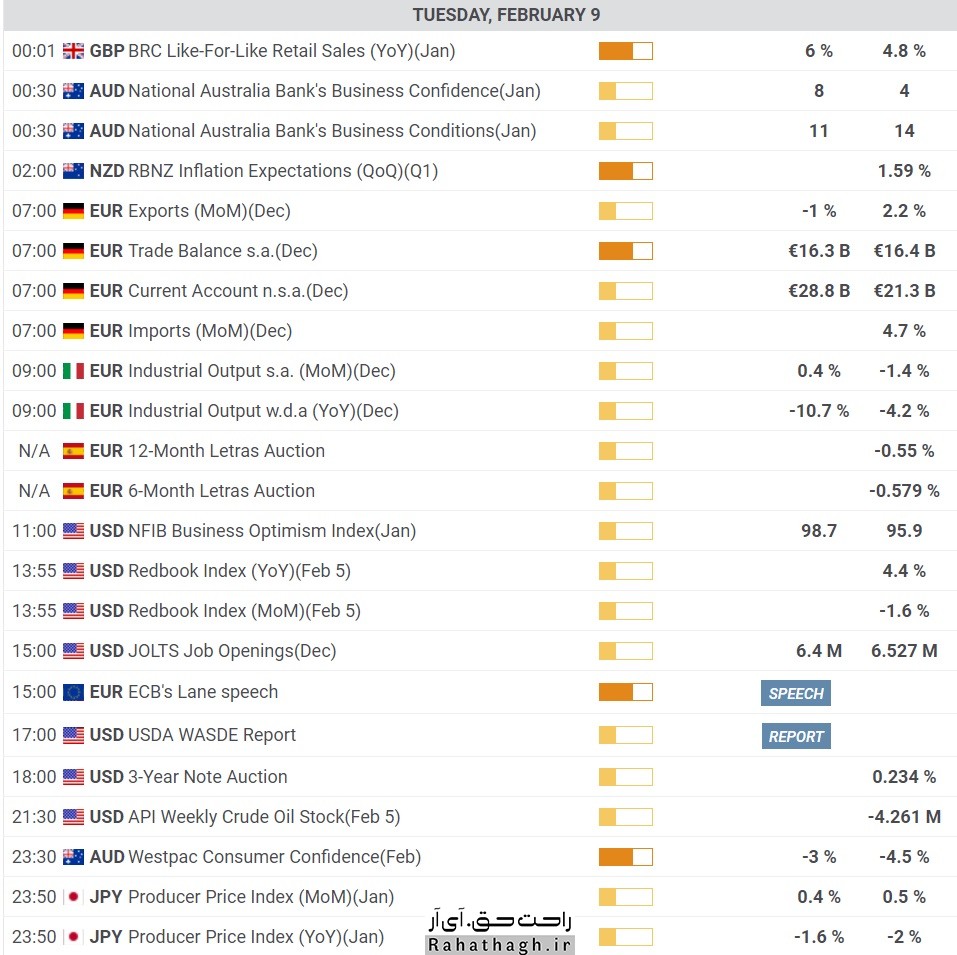
Economic calendar Tuesday, February 9

Economic calendar Tuesday, February 9

https://bayanbox.ir/view/3919658586713644405/eco9-2%D8%B1%D8%A7%D8%AD%D8%AA-%D8%AD%D9%82.jpg

۲۱ بهمن ۹۹ ، ۰۹:۰۰
حمید راحت حق

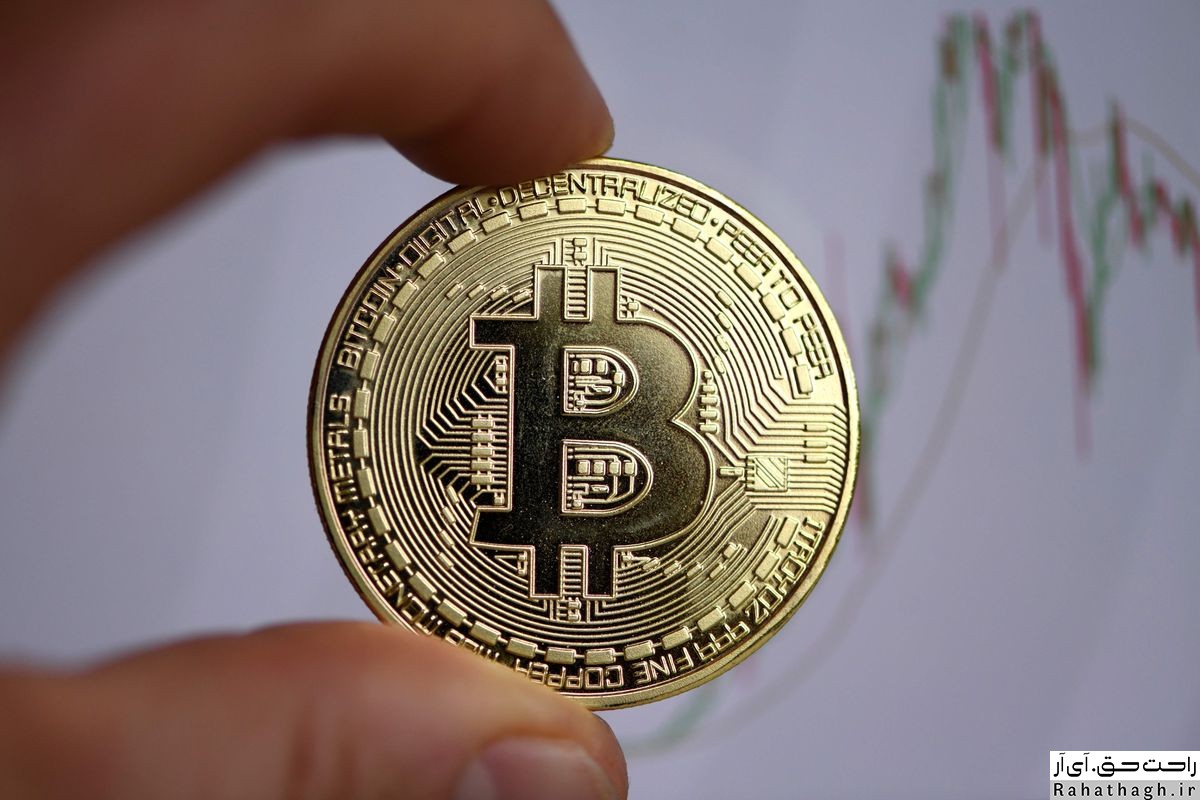
Bitcoin climbed above $ 40,000

Bitcoin climbed above $ 40,000

https://bayanbox.ir/view/7146113772604868447/https%D8%B1%D8%A7%D8%AD%D8%AA-%D8%AD%D9%82.jpg

Tesla wants to use bitcoin in its payments. The company has bought $ 1.5 billion worth of bitcoins and wants to accept bitcoin as the currency to buy the company's products in the near future. Bitcoin rose above $ 40,000 in response to this news.

۲۰ بهمن ۹۹ ، ۱۹:۵۵
حمید راحت حق

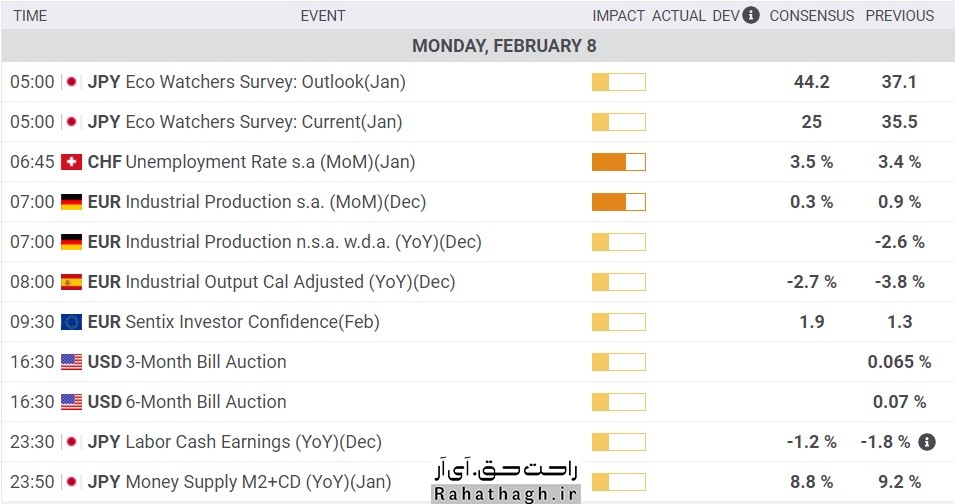
Economic calendar Monday, February 8

Economic calendar Monday, February 8

https://bayanbox.ir/view/3364979651332527956/eco8-2%D8%B1%D8%A7%D8%AD%D8%AA-%D8%AD%D9%82.jpg

۲۰ بهمن ۹۹ ، ۰۹:۰۰
حمید راحت حق

Bitcoin dominance reached its lowest level in three months!

Bitcoin dominance reached its lowest level in three months!

https://bayanbox.ir/view/8723914098953106175/bitcoindominance2%D8%B1%D8%A7%D8%AD%D8%AA-%D8%AD%D9%82.jpg
Bitcoin dominance, or the ratio of bitcoin market volume to other digital currencies, is approaching the psychological support floor recorded in mid-October 2020. Bitcoin dominance fell 11 percent in January. Here are some possible reasons for this decline.

Bitcoin dominance targets 60%!

Bitcoin bitcoin reached 60% yesterday. Bitcoin dominance registered on February 7 (February 19), the lowest bitcoin dominance since October 20, 2020 (October 29). Since then, the price of bitcoin has tripled.

At the time of writing, the bitcoin dominance is around 60%. According to TradingView, it is currently in the 61.95% range. But that's about 60.1 percent on Coingecko and about 61.93 percent on Binance's CoinMarketCap.

Thus, Bitcoin Dominance has lost all its gains since the December rally. On January 3, Bitcoin Dominance hit a 15-month high of 73%. Also, this increase in dominance could be related to the Ripple price drop, in which the share of this cryptocurrency in the digital currency market was greatly reduced.

Just one week after the US Securities and Exchange Commission complained about Ripple, Bitcoin's dominance grew by 7%. Some analysts at the time predicted that money would flow from the Ripple market to Bitcoin.

Binance Quinn, Cardano and Atrium, the three flagships of the Alt Quinn season!

On the other hand, the decline in bitcoin dominance led to the Altcoin season. This price rally can be seen in two parts: the top 10 altcoins on the market and DeFi tokens.

For example, the market's second-largest cryptocurrency, Atrium, has grown 116 percent since December, and two days ago, set a new historical price cap of $ 1,750 at most reputable exchanges.

Bainance Coin (BNB), which is the exclusive token of Bainance Exchange, was able to set new price records. In just seven days, the price of this cryptocurrency grew by 58%. At the time of writing, the price of this currency code is above $ 70.

Cardano (ADA), also known as a competitor to Atrium, has also managed to record a tremendous price rally, growing by 25% in the last 24 hours alone.

۱۹ بهمن ۹۹ ، ۲۱:۴۰
حمید راحت حق

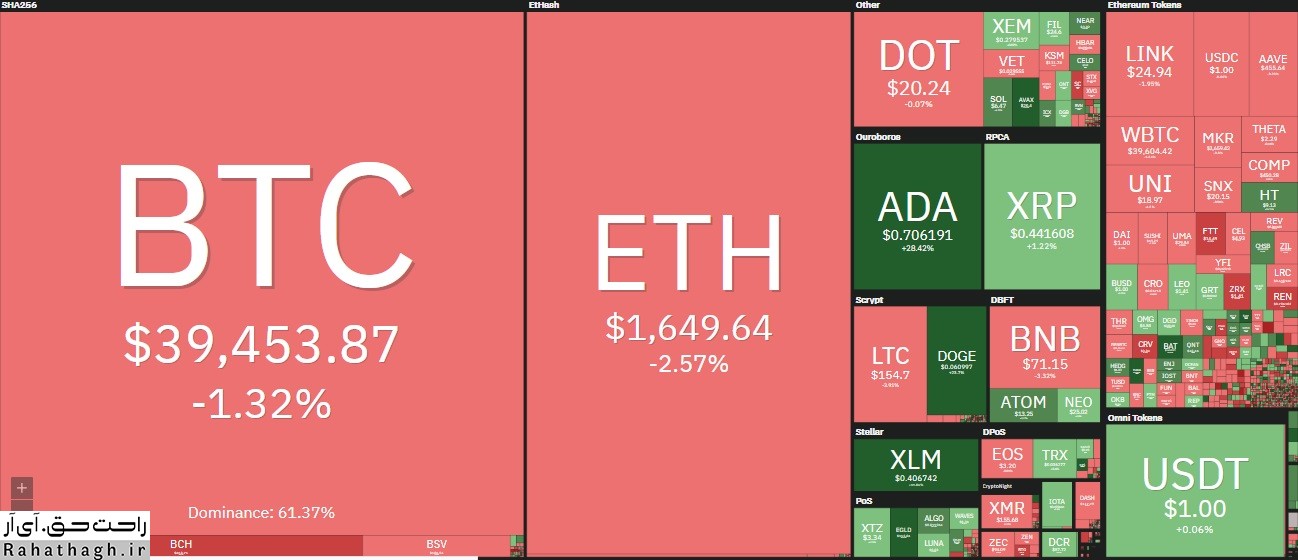
An overview of the cryptocurrency market today Saturday, February 7

An overview of the cryptocurrency market today Saturday, February 7

https://bayanbox.ir/view/6852144319028757239/crypto7-2%D8%B1%D8%A7%D8%AD%D8%AA-%D8%AD%D9%82.jpg
After another jump that pushed the BTC to $ 41,000, the cryptocurrency traded below $ 40,000. The value of the cryptocurrency market also reached a slump above $ 1.2 trillion.

Bitcoin touched the $ 41,000 level

After Monday's price drop, the price of Bitcoin was gradually rising until it exceeded the $ 37,000 level. Following this move, the cows raised it above $ 40,000.

In addition, Bitcoin touched the $ 41,000 price level. Thus, the market's top cryptocurrency was just $ 1,000 away from its record 42,000 (approximately 2%).

At this point, the bears took action and did not allow the currency to move further. On the contrary, BTC returned to the daily low of $ 38,000. However, since then, with a slight improvement in price, it has returned to the level of $ 39,000.

Technically, BTC still has to cross the $ 40,000, $ 40,735 and $ 41,000 resistance lines to challenge the $ 42,000 level. Conversely, support levels of $ 38,550 and $ 38,000 could help if prices fall again.

Cardano's new record

In the last few days, most alternative coins have been so successful that they have set new records for currencies such as Atrium, Polkadat and Binance Coin. As a result of these developments, the total value of the cryptocurrency market also reached a record $ 1.220 trillion.

However, the situation has changed somewhat in the last 24 hours. Atrium has dropped more than 2% and is currently trading below $ 1650. Bitcoin Cash (5%) also fell below $ 460. China Link (4-%), Polkadat (2-%) and LightQueen (4-%) are also red today. While BNB and XRP have made small gains.

In addition, Cardano showed the best performance among the top 10 currencies in the market with a significant increase of 23%. As a result of this move, the ADA has reached $ 0.67, which is the highest price for the currency code in the last 3 years.

Decentraland (30%), Dogecoin (21%), Quant (16%), Avalanche (16%), Huobi Token (14%), Elrond (14%) and Decred (13%) have all experienced double-digit price growth. .

Vs. Nexo (-11%), FunFair (-10%), Alpha Finance Lab (-10%), 0x (-9%), Ampleforth (-8%) and Ren (-7.5%) a significant percentage of They have lost their value.

۱۹ بهمن ۹۹ ، ۱۴:۱۱
حمید راحت حق

Weekly Gold Analysis Monday, February 7

Weekly Gold Analysis Monday, February 7

https://bayanbox.ir/view/9037470472824552199/gold7-2%D8%B1%D8%A7%D8%AD%D8%AA-%D8%AD%D9%82.jpg

The ounce of global gold in mid-August 2018, in the form of support hit $ 1160 and started a new bullish rally, so that the price of gold rose to $ 2075 over two years. This is a historic price point for gold. The upward movement of gold stopped after hitting the range of 2050-2075 and then we saw the entry of ounces of gold into the downtrend channel, so that the market moved to the moving average of 50.
The ounce of gold was resisted by $ 1875 and the moving average of 20, which resulted in the market moving to an average of 50. An ounce of gold has returned to the upside after each hit. So in this week's trading, if the 50-day moving average and the $ 1800 trend are turned into support, one can expect the market to return to the 20-day moving average, the $ 1875 level and finally the channel ceiling. The failure of the channel resistance can make the presence of gold buyers in the market more colorful.
But if the ounce of gold breaks the $ 1800 trend and the average of $ 50, the downtrend will pave the way around the $ 1700 trend.


Activists and investors in the global gold ounce market are skeptical about the future of the market, according to a weekly assessment by Kitco News. Although the majority of market traders expect the price of an ounce of global gold to rise in the coming weeks, among small investors, supporters of the uptrend are less than 50%.
Meanwhile, the price of an ounce of silver has returned below $ 27 and all growth since the beginning of last week has disappeared. The price of silver has fallen after reaching the highest price of the last eight years. The fall in the price of silver has negatively affected the views and expectations of retail investors. Analysts believe that small investors' pessimism about the silver market has spread to the global ounce gold market. Micro-investors, most influenced by the social network, expected a rapid return to the silver market, and this frustration may spread to the gold market.
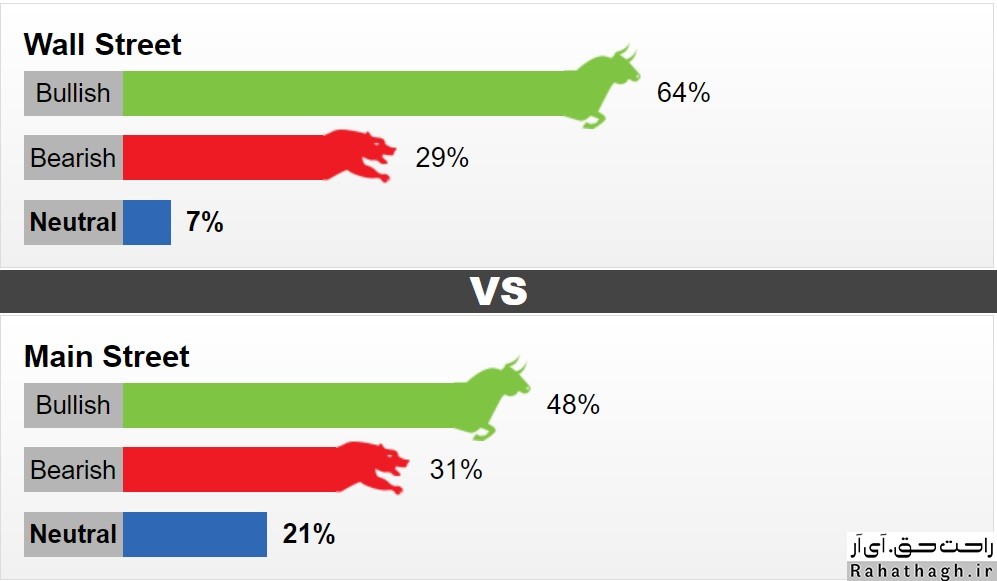
This week, 14 Wall Street activists took part in the weekly evaluation of the Kitco site. 64% predict that this week's trend will be an upward ounce of global gold. Another 29% predict that the market trend will be downtrend and another 7% expect the market to be trending or neutral. A total of 1,823 Main Street activists took part in the online poll. 48% are in favor of the uptrend, 31% are in favor of the downtrend and 21% are in favor of the neutral trend.
Kitco's online poll shows that micro-investor pessimism about the global ounce trend has reached its highest level since late November. At that time, the price of an ounce of world gold had fallen below $ 1,800. Last week, professional activists and small investors expected the price of an ounce of global gold to rise. However, the ounce price of global gold fell by almost 2%.


۱۹ بهمن ۹۹ ، ۱۳:۴۶
حمید راحت حق