
GBPUSD Thursday, February 11
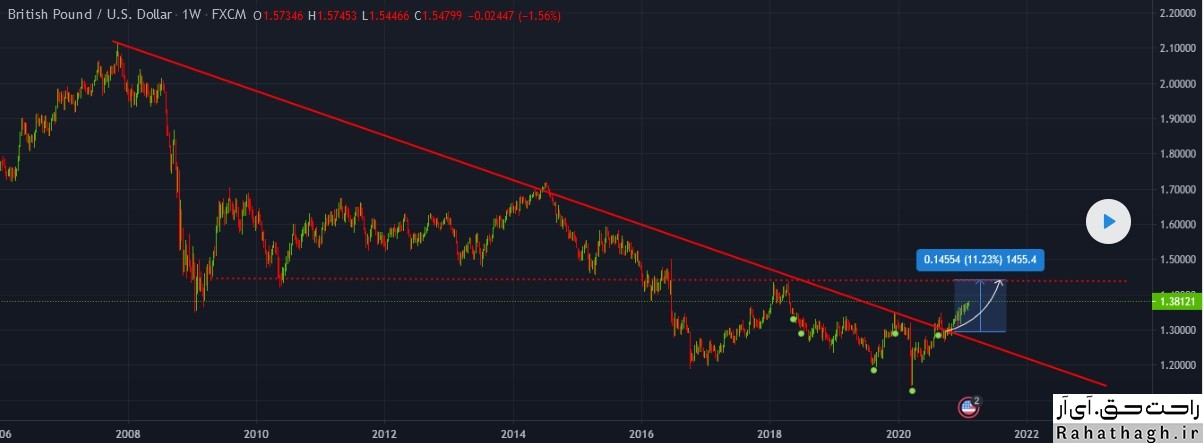
In the GBPUSD weekly chart, the market is still fluctuating between the weekly support of $ 1,3503 and the weekly resistance of $ 1,3847. According to the daily chart, the pound is approaching the resistance of $ 1.3847. Meanwhile, GBPUSD weekly and daily charts show no further support up to $ 1,3503. In the GBPUSD four-hour chart, the pound is bearish and the pound is engaged in short-term resistance at $ 1.3847. This key resistor also matches well with the weekly resistors. For this reason, it can be a good place to enter into a sales deal. If a bearish return from this range occurs, the pound could move to the support of 1.3752.
