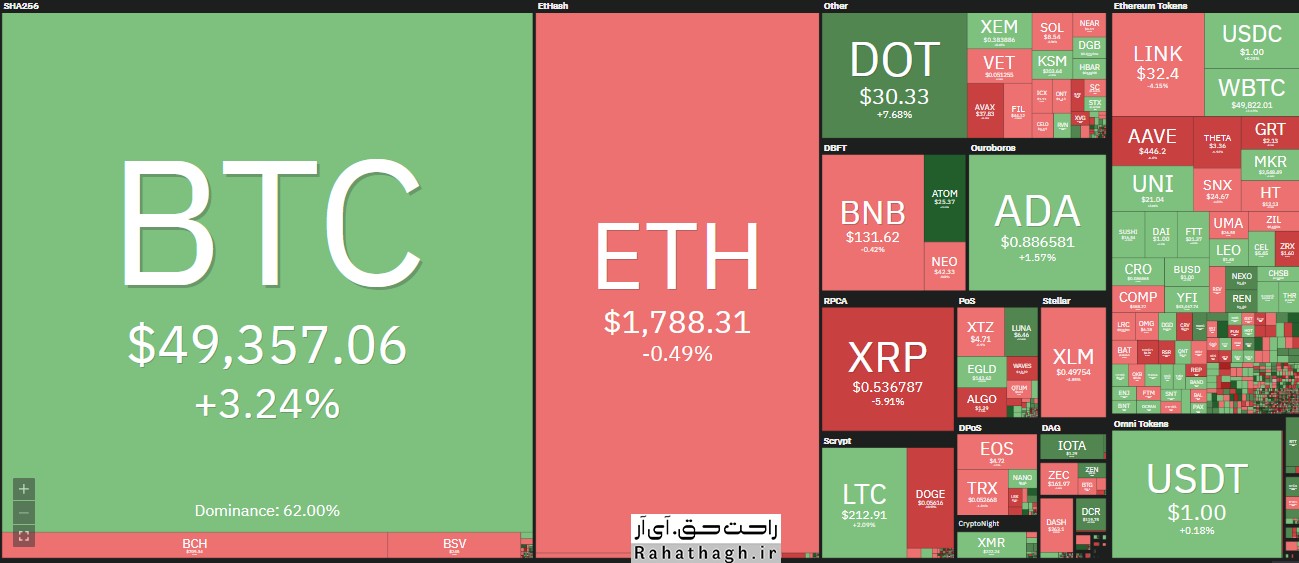
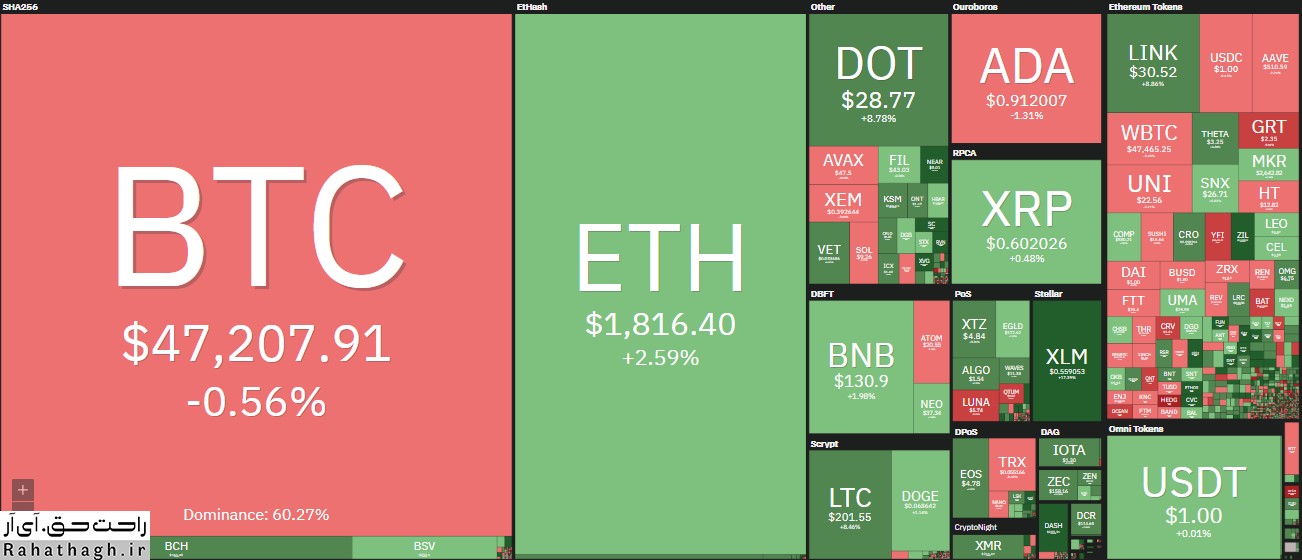
Ripple Analysis (XRP)
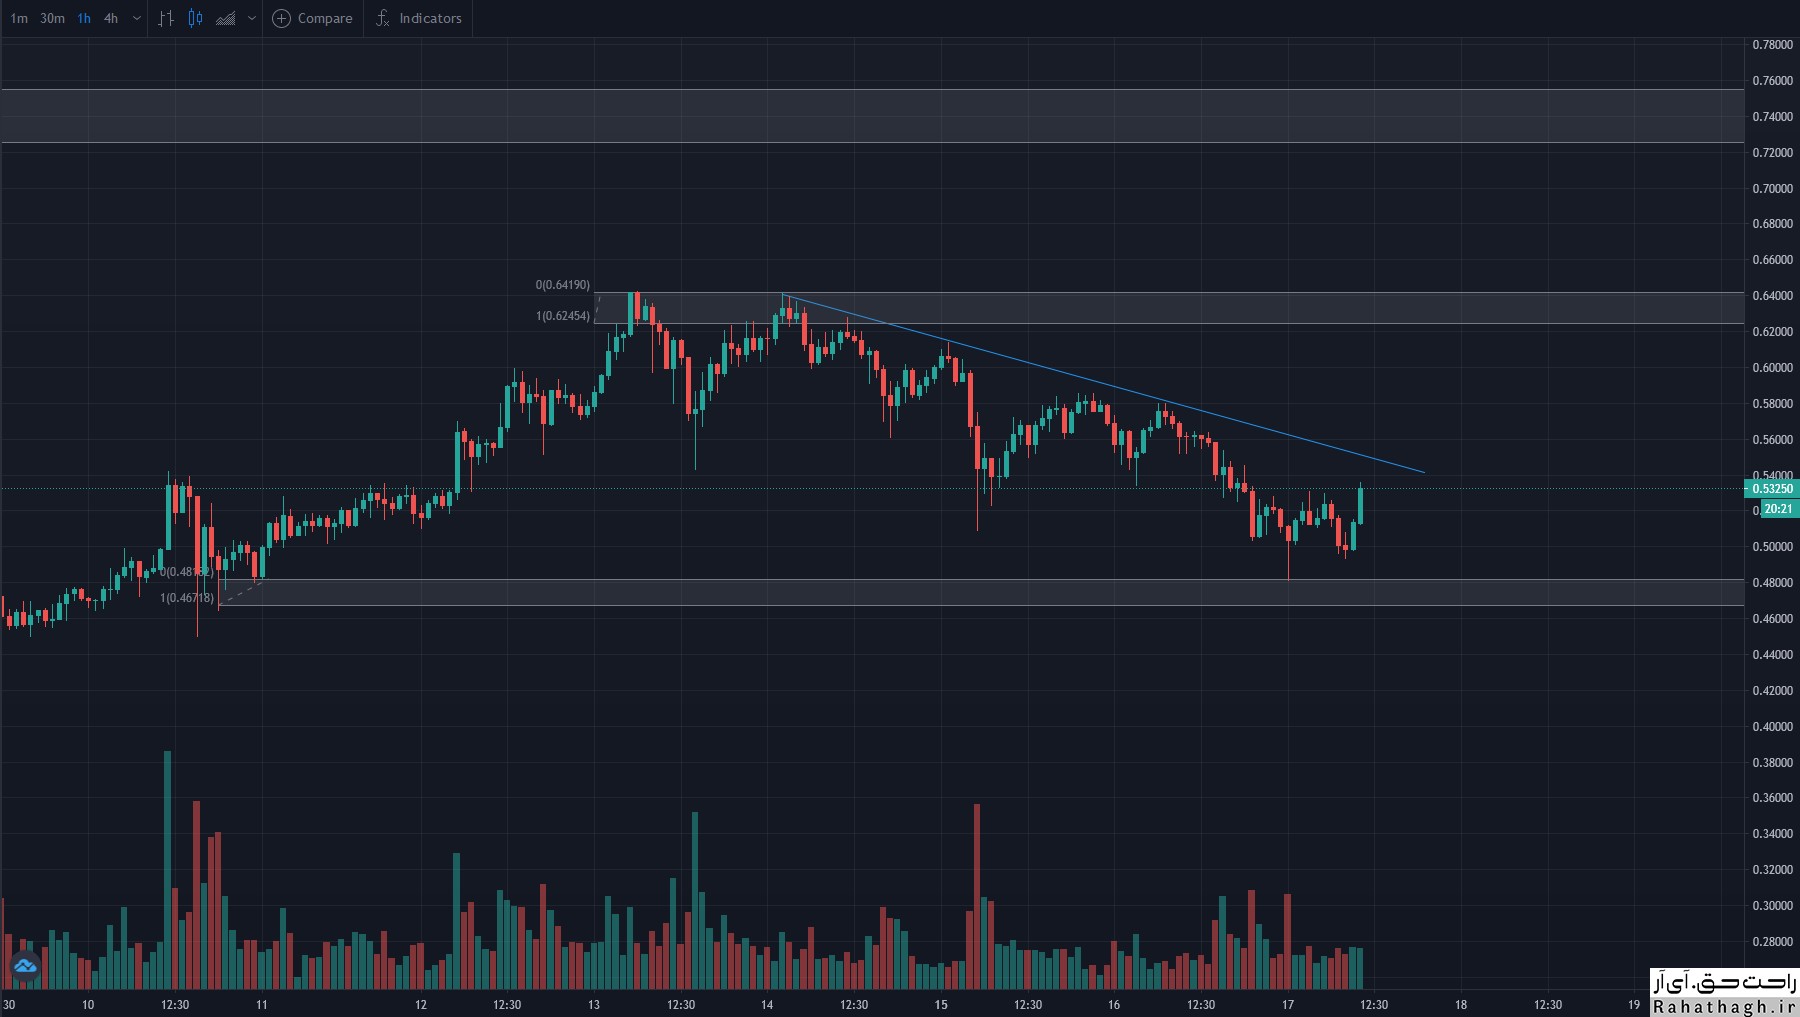
The price of Ripple Digital Currency is currently fluctuating in the range of $ 0.53302. The MACD and RSI indicators have also shown a downward trend.
However, the price continued its uptrend yesterday from the support range of $ 0.4880 to $ 0.4840. This level is the intersection of the 100 moving average indicator in the four-hour time frame and the downtrend line formed since February 2 (February 4) until now.
Currently, the 50-day moving average indicator level at $ 0.5460 and the Sunday bearish trend line at $ 0.56 play the resistance levels.
If the resistance breaks $ 0.56, the price will rise to the monthly downward trend line at $ 0.06150.
On the other hand, if the price penetrates below the support level of $ 0.4880 to $ 0.4840, one can expect the price to fall to $ 0.4 and the lowest monthly level at $ 0.3405.
Technical levels
Last price of the day: $ 0.5122
Daily fluctuations: 77- Pip
Fluctuations of the day (٪): 1.48-
Starting price: $ 0.5199
Trends
20-day moving average: $ 0.4632
50-day moving average: $ 0.3473
100-day moving average: $ 0.406
200-day moving average: $ 0.333
Levels
Yesterday's highest price: $ 0.58.03
Yesterday's lowest price: $ 0.4819
Last week's highest price: $ 0.6247
Last week's lowest price: $ 0.3911
Last month's highest price: $ 0.5167
Last month's lowest price: $ 0.2109
Fibonacci 38.2. Daily: $ 0.5195
Fibonacci 61.8. Daily: $ 0.5427
Pivot S1 Daily: $ 0.4745
Pivot S2 Daily: $ 0.429
Pivot S3 Daily: $ 0.3761
Pivot R1 Daily: $ 0.5728
Pivot R2 daily: $ 0.6258
Pivot R3 Daily: $ 0.6712
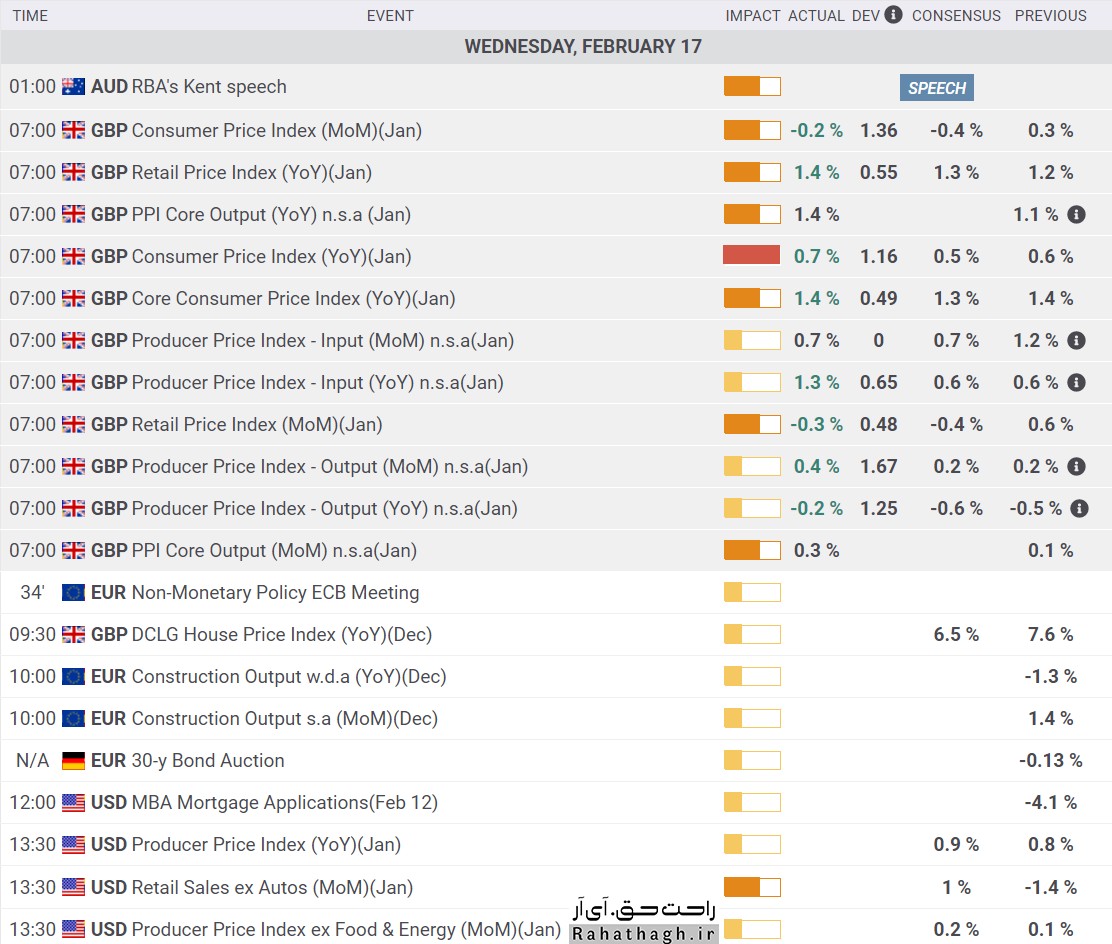
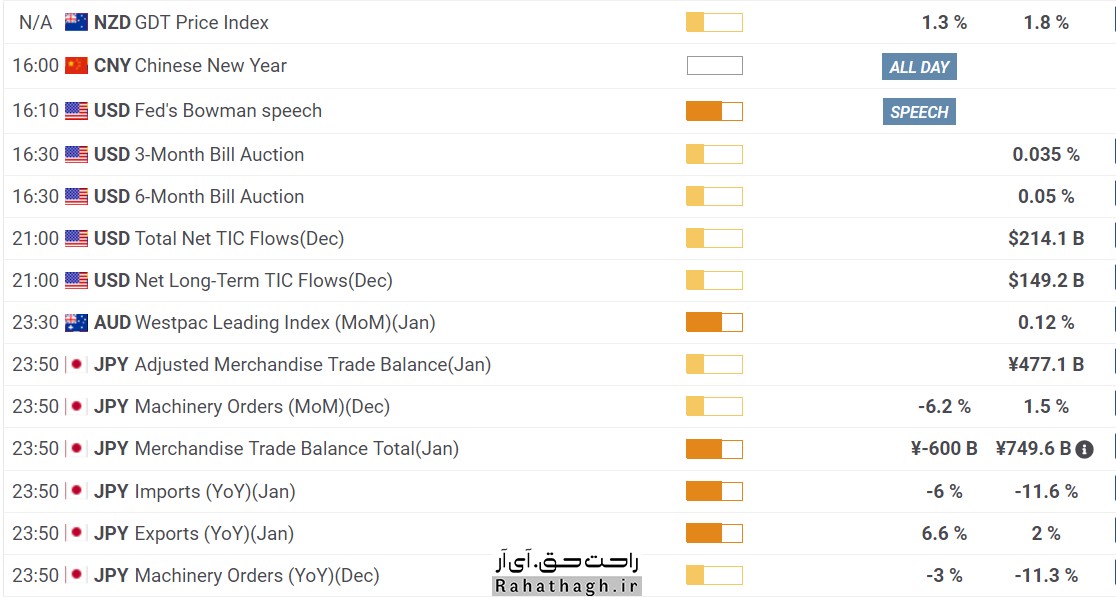
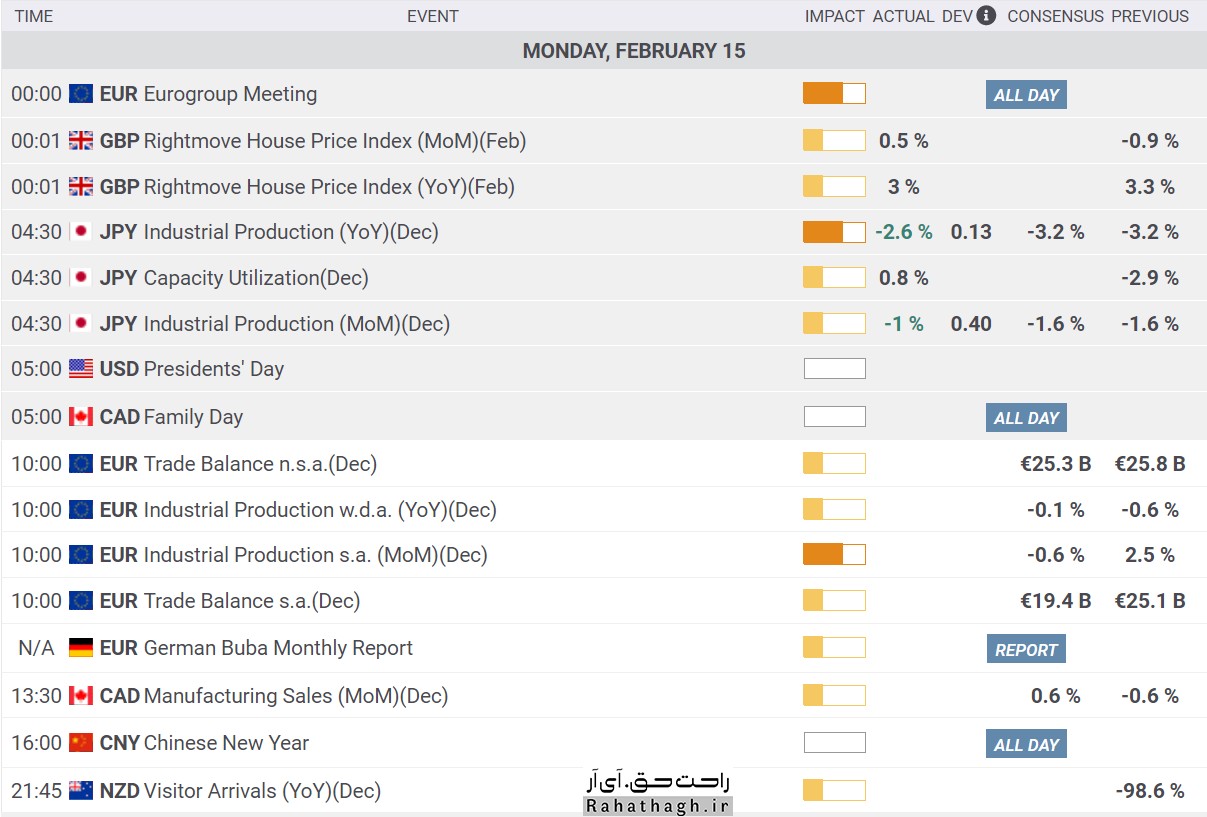
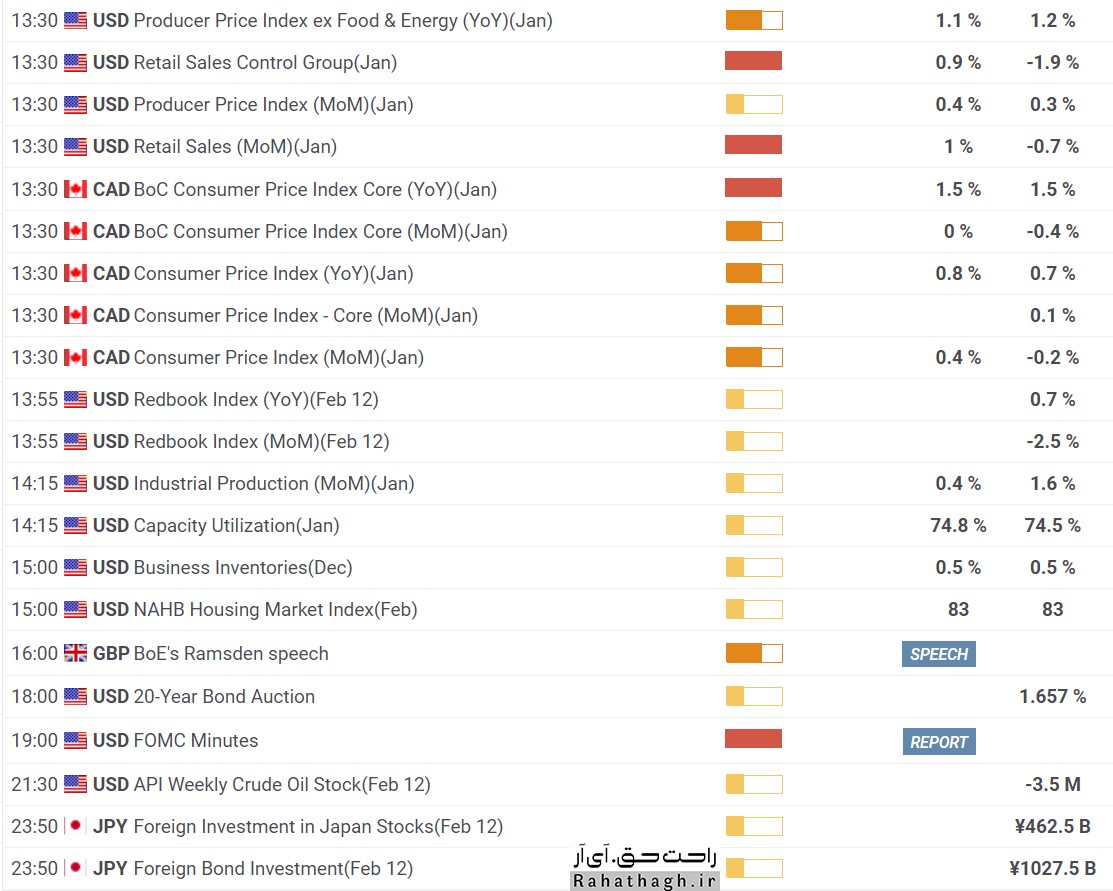 تقویم اقتصادی فارکس امروز