صفحه اصلی تقویم اقتصادی تحلیل رمزارزها (Cryptocurrency) تحلیل طلا (Gold) تحلیل فارکس (Forex) ارتباط با من درباره من
تحلیل فارکس (Forex) :: سایت تحلیل بورس، فارکس و ارز دیجیتال حمید راحت حق| Rahathagh.ir

اخبار و تحلیل نموداری و تکنیکالی بازارهای مالی دنیا اعم از بازار بورس داخلی، بازار فارکس، بازار طلا و بازار ارز دیجیتال و رمزارزها و روانشناسی بازار

۳۳ مطلب با موضوع «تحلیل فارکس (Forex)» ثبت شده است

AUDUSD analysis Tuesday, June 29

AUDUSD analysis Tuesday, June 29
The Australian dollar is likely to enter the daily and weekly support range

https://bayanbox.ir/view/3480557963826890179/AUDUSD-29-6-%D8%B1%D8%A7%D8%AD%D8%AA-%D8%AD%D9%82.jpg

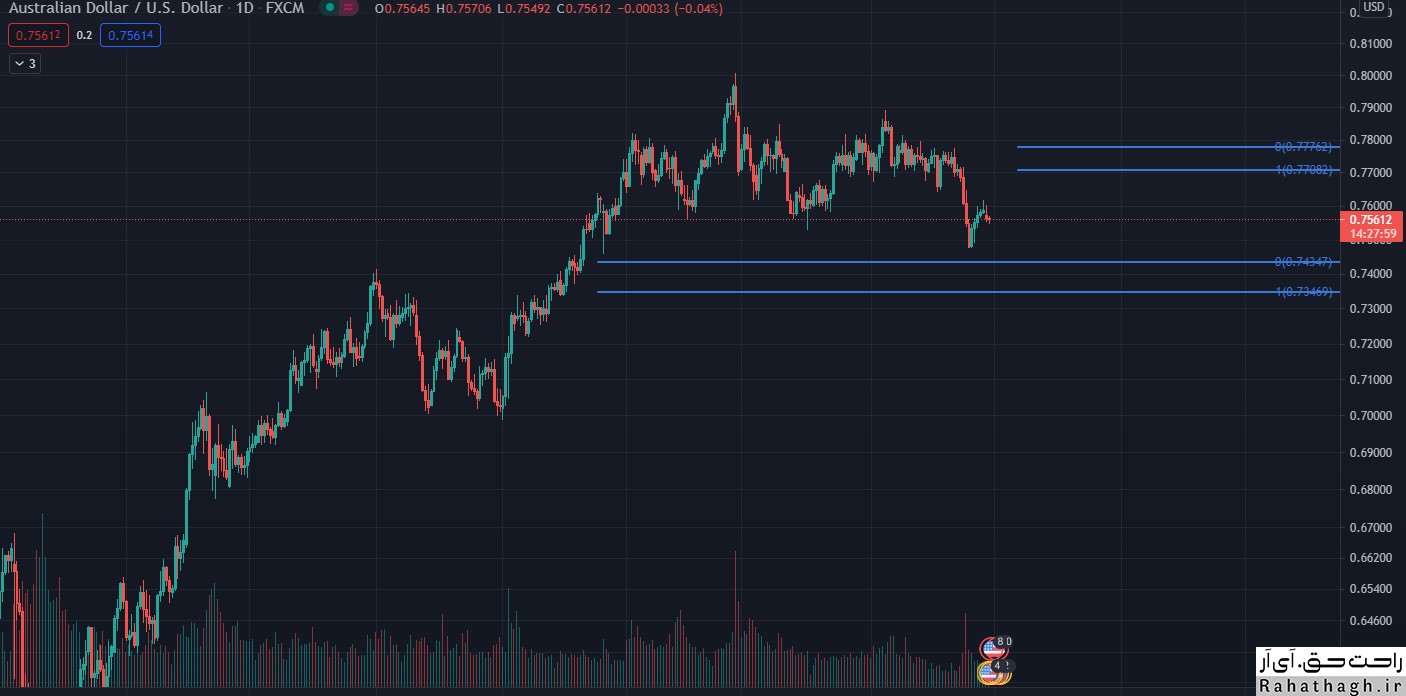
The weekly AUDUSD chart is supported at $ 0.7501. This support is consistent with a 50% Fibonacci correction and a 50 moving average. In the daily AUDUSD chart, the Australian dollar is under pressure to buy and has returned above the 200 moving average. If the Australian dollar continues to rise, it will face selling pressure at $ 0.7636.

The four-hour AUDUSD chart also fell to support at $ 0.7563. The Australian dollar has not been able to jump despite crossover moving averages. As a result, the Australian dollar is expected to fall to $ 0.7530 until further support and then to $ 0.7494 support.
But if the Australian dollar jumps from current levels, it will move towards resistance at 0.7632 and $ 0.7664.


Read more ...

AUDUSD Wednesday, January 27

Trading offers of Trading Central site  Forex market - Tuesday, April 13

۰۸ تیر ۰۰ ، ۱۱:۰۸
حمید راحت حق

EURUSD trend analysis Monday, June 28

EURUSD trend analysis Monday, June 28

https://bayanbox.ir/view/1976210477883216789/EURUSD28-6-%D8%B1%D8%A7%D8%AD%D8%AA-%D8%AD%D9%82.jpg 
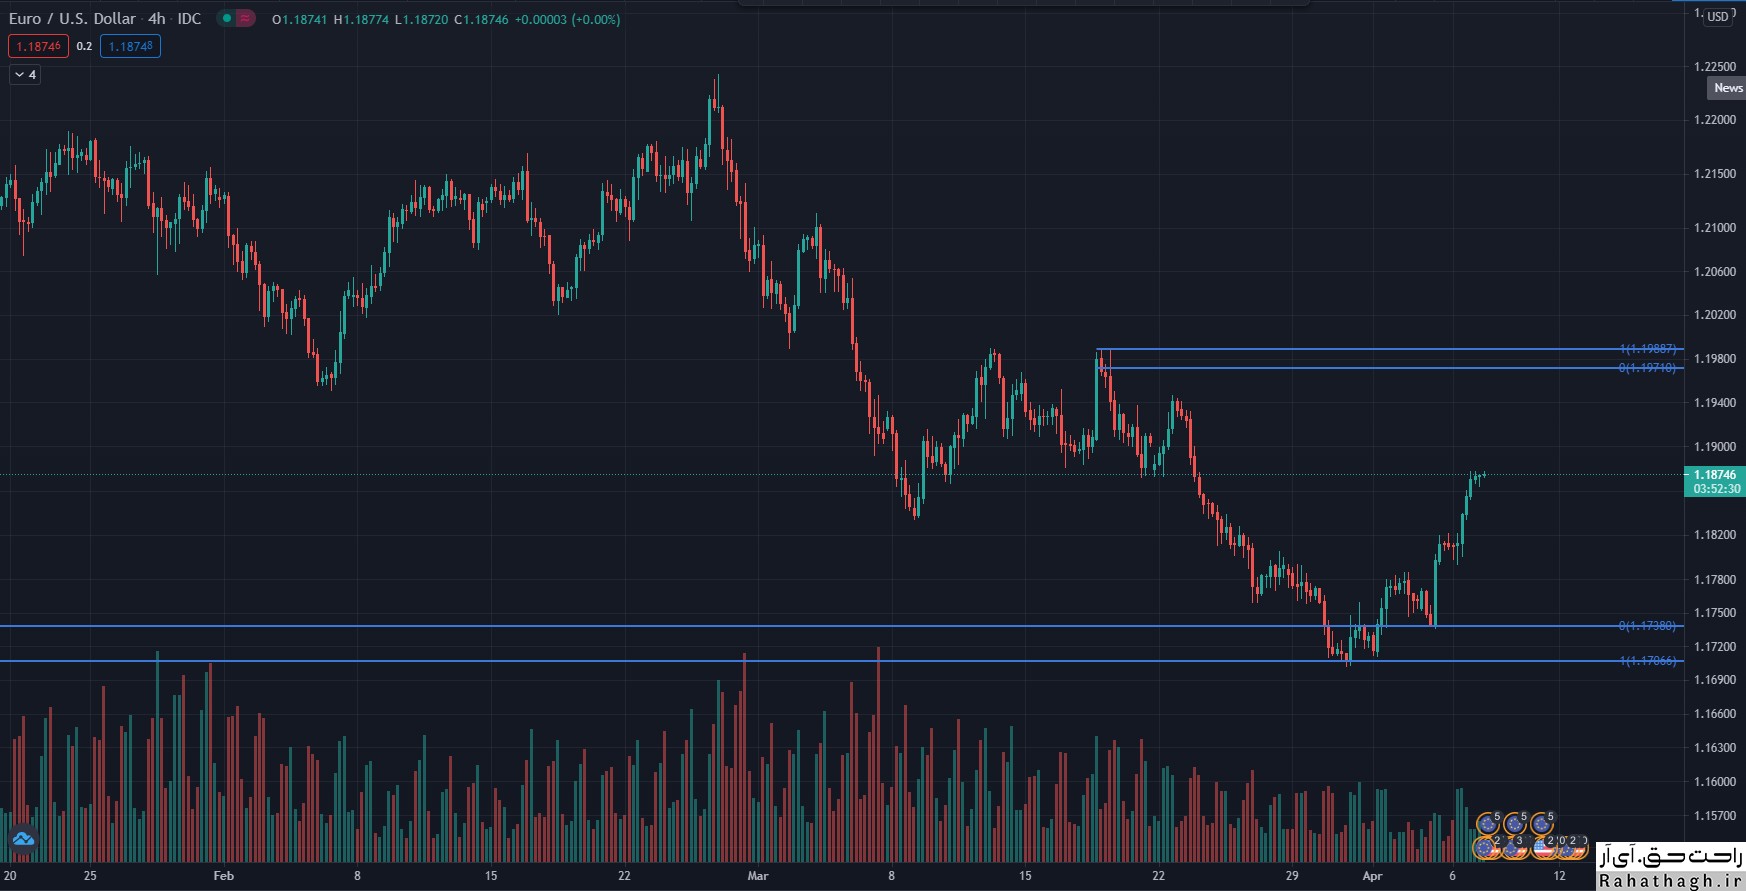
The short-term trend of the euro against the US dollar(EURUSD) is neutral. According to sellers, a break of $ 1,1846 could push the downtrend starting from $ 1,265 to the support of $ 1,1703. In the eyes of buyers, if the EURUSD pair crosses above the four-hour moving average of 55 days at $ 1.1967, the short-term market trend will rise to the resistance of $ 1.2265.


Read more ...

EURUSD trend analysis Friday, June 25

EURUSD analysis Wednesday, April 7

EURUSD analysis Tuesday, March 16

Check the EURUSD trend

EURUSD Thursday, February 11

EURUSD Tuesday, February 2

EURUSD  Wednesday, January 28

EURUSD Tuesday, January 26

۰۷ تیر ۰۰ ، ۱۲:۰۴
حمید راحت حق

USDJPY trend analysis Monday, June 28

USDJPY trend analysis Monday, June 28

https://bayanbox.ir/view/4445831641490762369/USDJPY-28-6-%D8%B1%D8%A7%D8%AD%D8%AA-%D8%AD%D9%82.jpg

The short-term trend of the US dollar against the Japanese yen(USDJPY) is neutral. As long as 109.70 support holds its position, we can expect another uptrend. With the break of 111.10, the key resistance of 111.71 will be the next target of the USDJPY. The break of this resistance could trigger a deep uptrend and move the market to the estimated 61.8% Fibonacci at 112.64. However, from the traders' point of view, if the pair crosses below the support of 109.70, the short-term trend of USDJPY will decline to the support of 107.47.


Read more ...

Weekly Analysis: Will USDJPY reach the bottom of the downtrend channel?

USDJPY Thursday, February 11

USDJPY currency pair trend


۰۷ تیر ۰۰ ، ۱۱:۵۸
حمید راحت حق

GBPUSD trend analysis Monday, June 28

GBPUSD trend analysis Monday, June 28

https://bayanbox.ir/view/7033196844065733983/gbpusd-28-6-%D8%B1%D8%A7%D8%AD%D8%AA-%D8%AD%D9%82.jpg

The short-term trend of the British pound against the US dollar is neutral. According to sellers, if the GBPUSD pair falls below the $ 1,3859 support, the downtrend will recover from $ 1,4248 and the market can move to the support of $ 1,3668. From the buyers' point of view, with the break of the $ 1.4000 rate, the short-term market trend will rise to the resistance range of 1.4248-1.4240.


Read more ...

GBPUSD trend analysis Friday, June 25

GBPUSD Wednesday, February 24


۰۷ تیر ۰۰ ، ۱۱:۴۷
حمید راحت حق

GBPUSD trend analysis Friday, June 25

GBPUSD trend analysis Friday, June 25
The pound is involved in long-term resistance

https://bayanbox.ir/view/7452047570046854619/gbpusd-forex-%D8%B1%D8%A7%D8%AD%D8%AA-%D8%AD%D9%82.jpg

The GBPUSD weekly chart has returned above the 20-day moving average and is facing selling pressures from the broken support line. The GBPUSD daily chart is also under pressure from $ 1,3961 and may fall to support at $ 1,3678. In the four-hour GBPUSD chart, the British pound has returned to support at $ 1.39. This trend rate is consistent with Fibonacci levels. Intensifying sell-offs could push the euro to its first support at $ 1,3859 and then to $ 1,3812.

But if the British pound jumps from current levels, it will face resistance at $ 1.4011 and the next resistance of the pound will be $ 1.4069.

۰۴ تیر ۰۰ ، ۱۲:۱۸
حمید راحت حق

EURUSD trend analysis Friday, June 25

EURUSD trend analysis Friday, June 25
Is the euro coming out of the neutral phase?

https://bayanbox.ir/view/2597440666664415863/eurusd-forex-%D8%B1%D8%A7%D8%AD%D8%AA-%D8%AD%D9%82.jpg

The short-term trend of the Euro against the US Dollar is neutral and the EURUSD pair fluctuates above the rate of $ 1,1846. According to sellers, a break of $ 1,1846 could push the downtrend starting from $ 1,265 to the support of $ 1,1703. In the eyes of buyers, if the EURUSD pair crosses above the four-hour moving average of 55 days at $ 1.1976, the short-term trend of the market will rise to the resistance of $ 1.2265.

۰۴ تیر ۰۰ ، ۱۲:۱۱
حمید راحت حق

*Apple's market [value] is expected to reach $ 3 trillion by 2022

Apple's market value is expected to reach $ 3 trillion by 2022

https://bayanbox.ir/view/8426814561593647932/apple-market-value-%D8%B1%D8%A7%D8%AD%D8%AA-%D8%AD%D9%82.jpg During yesterday's trading session, Apple Stock (NASDAQ: AAPL) rose about 0.21%, ending yesterday's session with a market value of about $ 2.1 trillion. Today, Apple is trading at $ 127.13, up 0.39%. Meanwhile, Dan Eves, a well-known market analyst from Wedbush, has stated that he expects the company to reach a market value of $ 3 trillion by 2022.

AAPL Stock Outlook

Among FAANG shares, Apple was the second lowest performing company. The company has fallen 4.48% since the beginning of the year. This decrease reached 11.7% in December.

Nevertheless, the $ 2.1 trillion tech giant still tops the list of the world's most valuable companies. The company's market value crossed the $ 1 trillion mark in 2018 and the $ 2 trillion mark in 2020, creating a trend that is expected to cross the $ 3 trillion mark in 2022.

Ives' view is particularly uplifting about the company's $ 1 trillion software business. He expects the figure to reach about $ 1.5 trillion soon, which in turn will help boost the company's market value.

۲۰ خرداد ۰۰ ، ۱۶:۰۱
حمید راحت حق

Trading offers of Trading Central site Forex market - Tuesday, April 13

Trading offers of Trading Central site  Forex market - Tuesday, April 13

 Euro / US dollar

Offer: sell below point 1.2020 with first profit tick 1.1870 and second profit tick 1.1860
Alternative offer: (If the price trend changes) When the price penetrates above 1.2020, the price first starts moving towards 1.1940 and 1.1960.

https://uupload.ir/files/rtu4_f13-4-1-%D8%B1%D8%A7%D8%AD%D8%AA-%D8%AD%D9%82.png


British Pound / US Dollar

Offer: Sales below 1.3765 with a first profit tick of 1,3705 and a second profit tick of 1,3685
Alternative offer: (In case of price trend change) When the price penetrates above 1.3765, the price first starts moving towards 1.3780 and 1.3800.

https://uupload.ir/files/op8r_f13-4-2-%D8%B1%D8%A7%D8%AD%D8%AA-%D8%AD%D9%82.png

US Dollar / Japanese Yen

Offer: Trading below 109.55 with a first profit tick of 109.00 and a second profit tick of 108.75
Alternative offer: (If the price trend changes) When the price penetrates above 109.55, the price first starts moving towards 109.75 and 109.95.

https://uupload.ir/files/n2mn_f13-4-3-%D8%B1%D8%A7%D8%AD%D8%AA-%D8%AD%D9%82.png

US Dollar / Swiss Franc

Offer: Buy point above 0.9215 with the first check tick of 0.9270 and the second check tick of 0.9290
Alternative offer: (If the price trend changes) When the price penetrates below 0.9215, the price first starts moving towards 0.9200 and 0.9185.

https://uupload.ir/files/t2rf_f13-4-4-%D8%B1%D8%A7%D8%AD%D8%AA-%D8%AD%D9%82.png

Australian dollar / US dollar

Offer: sell below 0.7635 with a first profit tick of 0.7590 and a second profit tick of 0.7570
Alternative offer: (In case of price trend change) When the price penetrates above 0.7635, the price first starts moving towards 0.7660 and 0.7680.

https://uupload.ir/files/083o_f13-4-5-%D8%B1%D8%A7%D8%AD%D8%AA-%D8%AD%D9%82.png

US Dollar / Canadian Dollar

Offer: Buy a deal above the point of 1. 2565 with the first profit tick of 1.2635 and the second profit tick of 1.2650
Alternative offer: (In case of price trend change) When the price penetrates below 1.2565, the price first starts moving towards 1.2535 and 1.2520.

https://uupload.ir/files/45g9_f13-4-6-%D8%B1%D8%A7%D8%AD%D8%AA-%D8%AD%D9%82.png

۲۴ فروردين ۰۰ ، ۱۹:۲۴
حمید راحت حق

EURUSD analysis Wednesday, April 7

EURUSD analysis Wednesday, April 7

https://s17.picofile.com/file/8429907600/eurusd7_4_%D8%B1%D8%A7%D8%AD%D8%AA_%D8%AD%D9%82.jpg
In the EURUSD weekly chart, the euro jumped from the support of $ 1,1620 and can rise to higher levels. The next resistance is EURUSD at $ 1.80. On the EURUSD daily chart, we see a similar uptrend, with the euro strengthened by $ 1.1710 support. In the EURUSD four-hour chart, the euro jumped to support at $ 1,1797. This support is in good agreement with an estimate of 78.6% Fibonacci and a correction of 50% Fibonacci.

The $ 1.80 resistance area and the $ 1.1797 support area are key EURUSD levels.


-----------------------------------------------

Read more ...

Previous analysis EURUSD

۱۸ فروردين ۰۰ ، ۱۰:۴۲
حمید راحت حق

EURUSD analysis Tuesday, March 16

EURUSD analysis Tuesday, March 16

https://s16.picofile.com/file/8428127326/eurusd16_3_%D8%B1%D8%A7%D8%AD%D8%AA_%D8%AD%D9%82.jpg
The short-term trend of the euro against the US dollar is neutral. From the buyers' point of view, if the EURUSD pair crosses above the $ 1.89 slight resistance, the 55-day moving average at $ 1,2049 will be the next target of the market. A definite break of these levels will mark the end of the correctional movement starting from $ 1,2348 and the EURUSD will be ready to hit the price peak again. However, from the sellers' point of view, the failure of $ 1,1834 will pave the way for the market to correct 38.2% Fibonacci at $ 1,1694.

۲۶ اسفند ۹۹ ، ۰۹:۴۹
حمید راحت حق