صفحه اصلی تقویم اقتصادی تحلیل رمزارزها (Cryptocurrency) تحلیل طلا (Gold) تحلیل فارکس (Forex) ارتباط با من درباره من
سایت تحلیل بورس، فارکس و ارز دیجیتال حمید راحت حق| Rahathagh.ir

اخبار و تحلیل نموداری و تکنیکالی بازارهای مالی دنیا اعم از بازار بورس داخلی، بازار فارکس، بازار طلا و بازار ارز دیجیتال و رمزارزها و روانشناسی بازار

Bitcoin failed to break the $ 35,000 resistance level

Bitcoin failed to break the $ 35,000 resistance level

https://bayanbox.ir/view/2272044993786151009/0da66d1571aa77e%D8%B1%D8%A7%D8%AD%D8%AA-%D8%AD%D9%82.jpg


In the last 24 hours, the Bitcoin digital currency (BTC) has fallen again after another unsuccessful attempt to reach the $ 35,000 channel and is currently trying to maintain levels above $ 31,000. Most Altcoins, following their leader, also experienced a downward trend, with the total value of the digital currency market falling by about $ 80 billion over the past 24 hours.

In the last few days, after the price of Bitcoin fell below $ 29,000, this digital currency was able to increase its price up to $ 35,000 by taking an upward trend. However, while the cows were preparing to further increase the price of bitcoin, the bears took control of the market and pushed the digital currency back.

In the following hours, Bitcoin lost about $ 4,000 and fell to $ 31,000. Technical indicators show that the $ 31,000 level is the first post-correction support level that Bitcoin can rely on. In the event of a further drop in the price of Bitcoin, this digital currency will test the next support level at $ 30,760 before it reaches the psychological level of $ 30,000.

۰۷ بهمن ۹۹ ، ۱۹:۴۲
حمید راحت حق

The new chairman of the stock exchange came

The new head of the Iran Stock Exchange Organization has been identified.
Hossein Salahvarzi, a member of the Supreme Council of the Stock Exchange, confirmed the appointment of Ali Dehghan Dehnavi as the new head of the Stock Exchange and Securities Organization and said: There was market guidance.
Dehnavi, who holds a doctorate in economics from Tarbiat Modares University, was previously a board member of the Housing Bank and now serves as Deputy Minister of Economy in the Ministry of Economic Affairs and Finance. Dehnavi is also a member of the faculty of the Department of Finance and Banking of Allameh Tabatabaei University and the Vice Chancellor for Education of the Higher Institute of Banking Education in Iran.


https://bayanbox.ir/view/6785740467520712196/%D8%B1%D8%A7%D8%AD%D8%AA-%D8%AD%D9%82-%D8%A8%D9%88%D8%B1%D8%B3.jpg


This is also a poem from stock exchange poems

My days are not bad.

I have a share, a small profit, the needle of fairness.
I have a broker, better than cabbage leaves.
Friends, better than wolves and jackals.

And nearby stocks:
Along with this sugar, its legs melt long.
On Kasra and Ghapak, on Maroon and Kegel.

I am greedy.
My love is money and dollars
My share is Fajr and Kachad
My sugar sugar crumbs.
I fluctuate with broker credit.

In my purchase, there is deceit, there is oppression.
Shame is behind my words:
All the particles of my being have been cheated.
I take my stock
I will buy then
That its seller
From the tightness of the hand
It wraps itself
And at noon,
Everyone is confused and scared.

I swing
My profession is painting:
Sometimes I make a basket with a share, I sell it to you

To refresh your mind to the modification in which he is imprisoned.
What imaginary, what imaginary, ... I know
My table is without bread.
I know, my painting pond is lifeless


۰۷ بهمن ۹۹ ، ۱۹:۲۸
حمید راحت حق

GOLD Tuesday, January 26

GOLD Tuesday, January 26

https://bayanbox.ir/view/2148848428967361016/GOLD%D8%AD%D9%85%DB%8C%D8%AF-%D8%B1%D8%A7%D8%AD%D8%AA-%D8%AD%D9%82.jpg


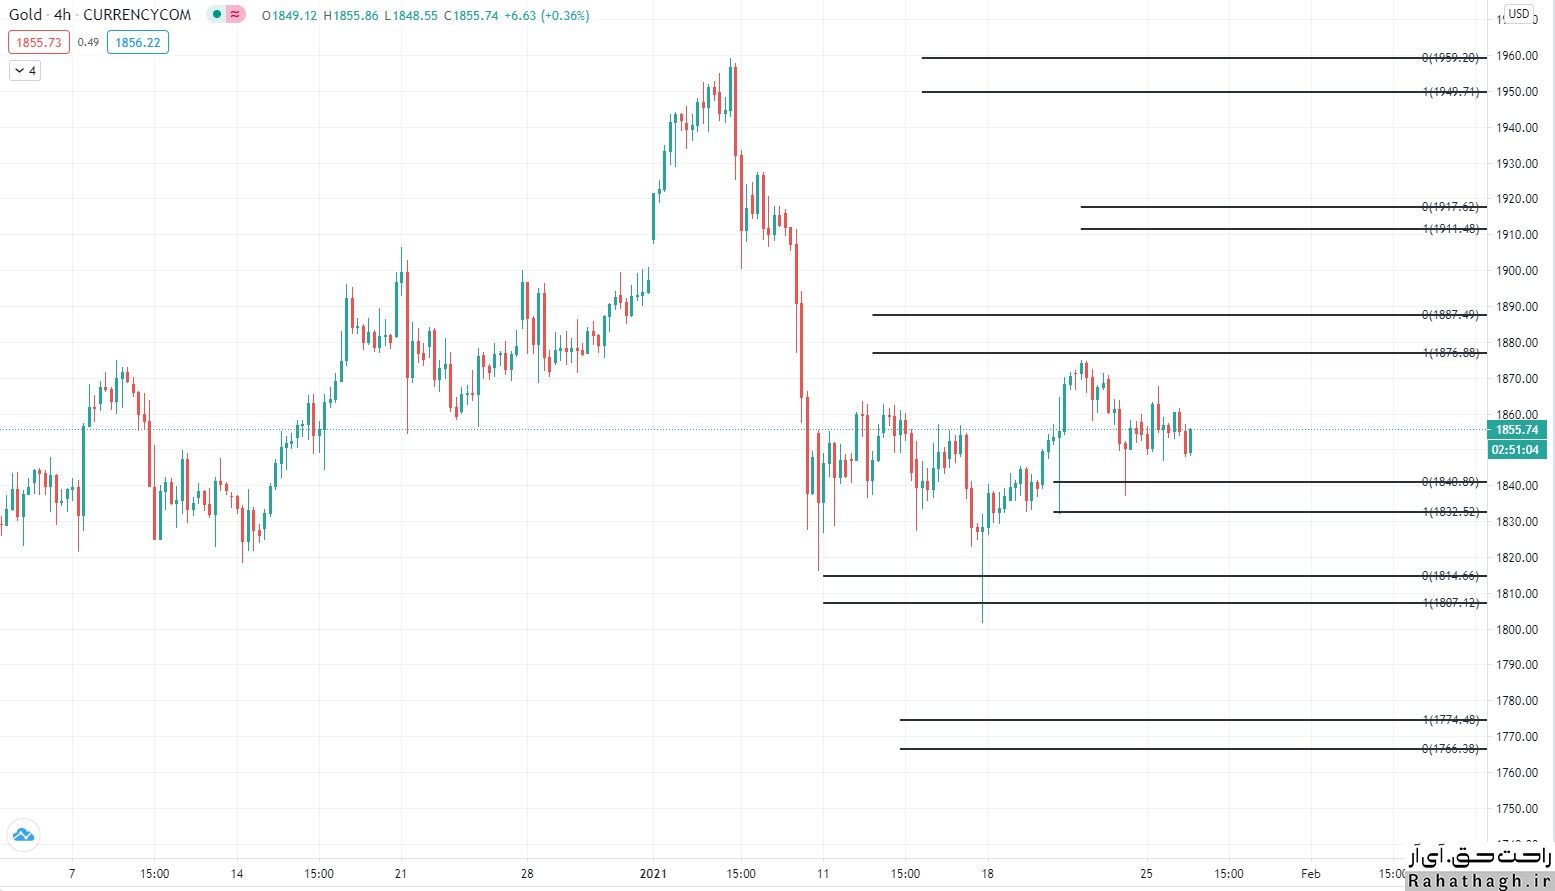
The weekly ounce chart of global gold can bring buyers into the market due to the recent reversal and uptrend. It should also be noted that the weekly chart shows support at $ 1787 and $ 1738 and resistance at $ 1950.
In the XAUUSD daily chart, the market has also reacted positively to the simple moving average of 200 days. Aside from the 1959 high in early January, buyers should also consider the key resistance of $ 1966. Also below the 200-day moving average, $ 1746 support is below the 100% Fibonacci estimate (1756), the 50% Fibonacci retracement at 1762 and the 127.2% Fibonacci estimate at $ 1740.
In the four-hour chart, XAUUSD may push market buyers to the November reopening rate of $ 1878. However, if the global ounce of gold falls, it will fall to the support of $ 1822. At the same time, the four-hour AB = CD pattern is completed around $ 1920 and $ 1910, which can bring sellers to market. Although this pattern could lower the price of an ounce of global gold, given the state of long-term charts, the likelihood of a drop in gold prices will be limited.

۰۷ بهمن ۹۹ ، ۱۵:۴۴
حمید راحت حق

USDCHF Tuesday, January 26

USDCHF Tuesday, January 26


https://bayanbox.ir/view/5943617033522989711/USD-CHF-2-800x533-L-1417096297-%D8%B1%D8%A7%D8%AD%D8%AA-%D8%AD%D9%82.jpg

The short-term trend of the US dollar against the Swiss franc is neutral. From the buyers' point of view, a definite resistance break of 0.8925 could indicate the formation of a short-term price floor at 0.8756. In this case, the short-term trend of the USDCHF pair will rise to the level of 38.2% Fibonacci at 0.9193. However, if the USDCHF falls below the partial support of 0.8821, the pair can maintain its short-term downtrend and the USDCHF will be ready to re-hit the price level of 0.8756.

۰۷ بهمن ۹۹ ، ۱۵:۳۰
حمید راحت حق

EURUSD Tuesday, January 26

EURUSD Tuesday, January 26

https://bayanbox.ir/view/7071595383620144368/EUR1-%D8%B1%D8%A7%D8%AD%D8%AA-%D8%AD%D9%82.jpg


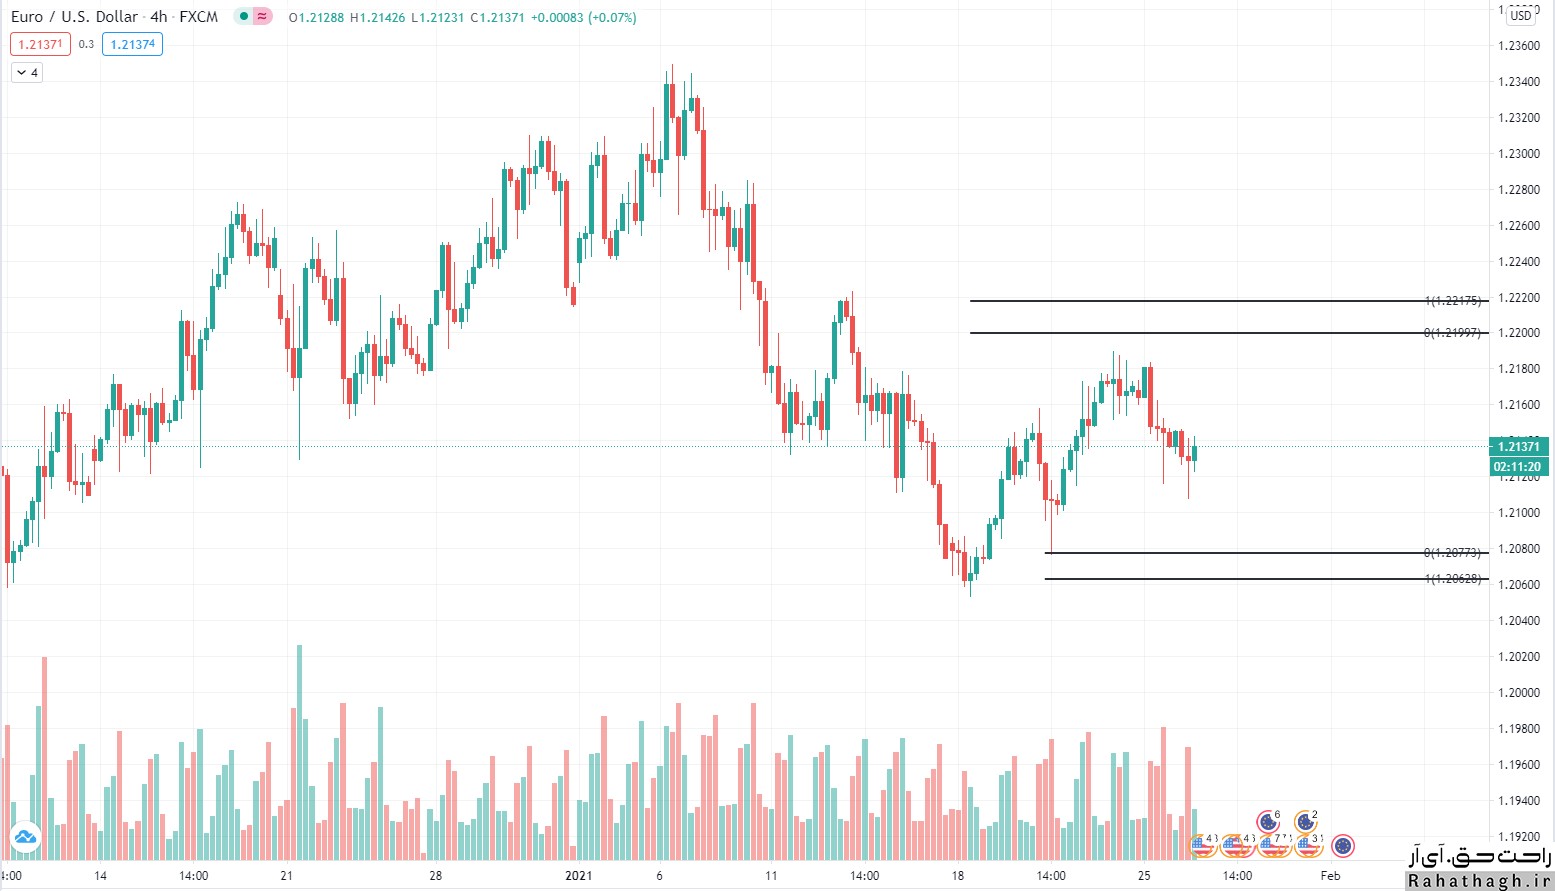
The short-term trend of the euro against the US dollar is neutral. From the buyers' point of view, if the EURUSD pair crosses the above resistance level of $ 1.2222, it can continue the upward return from $ 1.2052 and be prepared to hit the price level of $ 1.2348 again. However, from the sellers' point of view, the definitive failure of the support of $ 1,2052 could indicate the entry of the currency pair into the correction phase starting from the rate of $ 1,2348. In this case, the short-term trend of EURUSD will fall to $ 1.1887 at the correction of 61.8% Fibonacci.

۰۷ بهمن ۹۹ ، ۱۵:۲۳
حمید راحت حق

GBPUSD Tuesday, January 26

GBPUSD Tuesday, January 26

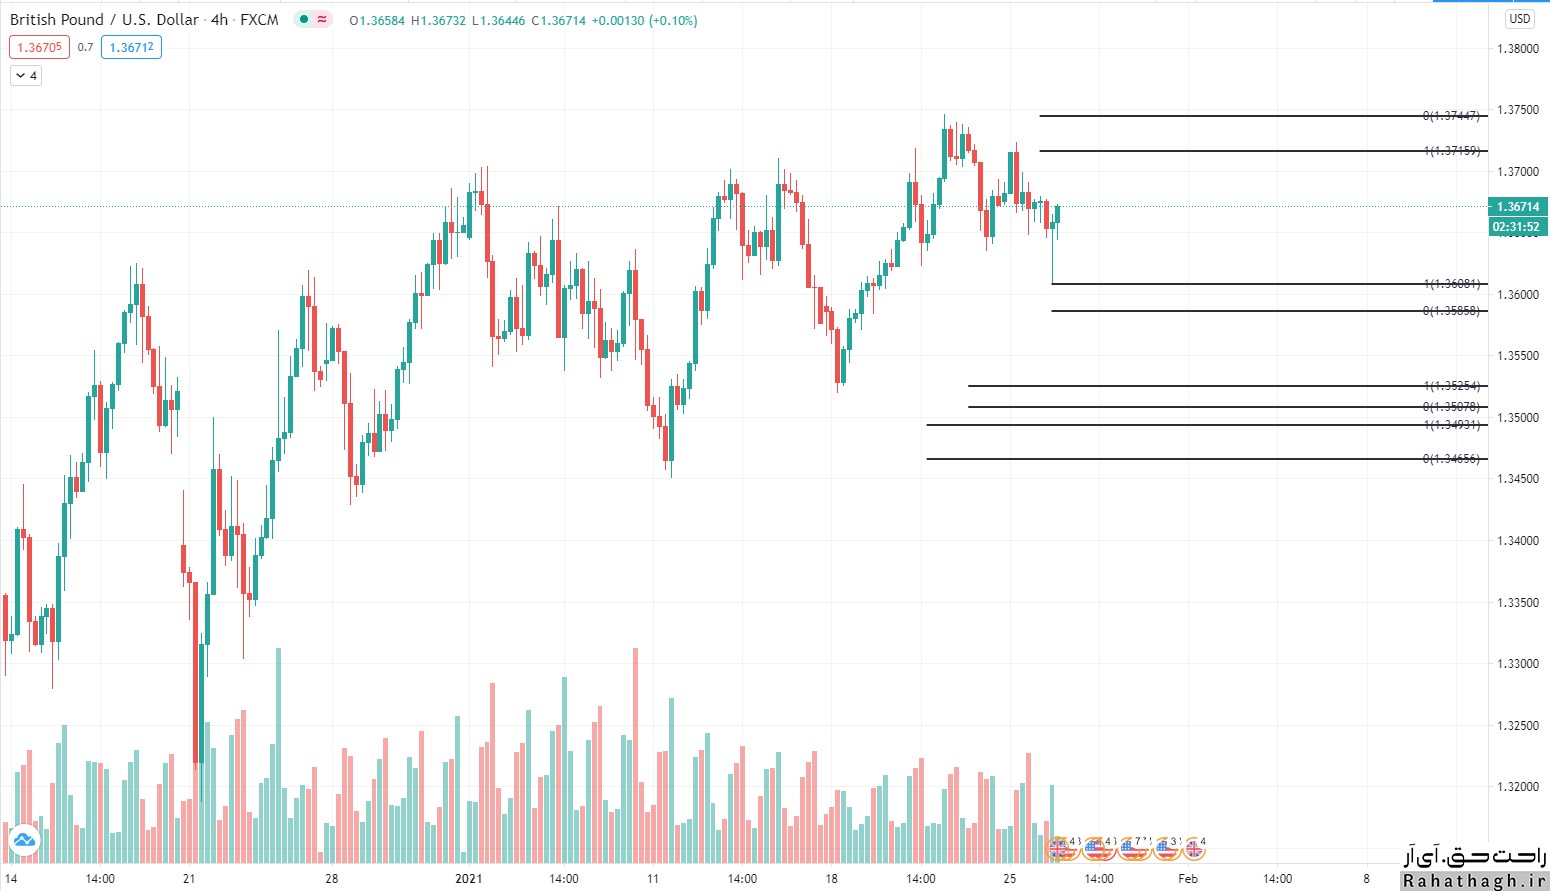
GBPUSD fluctuates below $ 1.3745 and the short-term trend of the British pound against the US dollar is neutral. As long as the $ 1,3518 support holds its position, one can expect another uptrend. A break of $ 1,3745 could boost the GBPUSD short-term trend and extend the uptrend from $ 1,1409 to the 61.8% Fibonacci retracement at $ 1,3956. From the sellers' point of view, if the GBPUSD currency pair falls below $ 1.3518, it will indicate the formation of a short-term price peak. A downward divergence is seen in the four-hour MACD indicator. If this divergence works, the short-term market trend will decline.

https://bayanbox.ir/view/4273934168038246888/gbp%D8%B1%D8%A7%D8%AD%D8%AA-%D8%AD%D9%82.jpg

۰۷ بهمن ۹۹ ، ۱۵:۰۸
حمید راحت حق

Economic calendar Tuesday, January 26

Economic calendar Tuesday, January 26


https://bayanbox.ir/view/5873060284228572252/econo1.jpg

۰۷ بهمن ۹۹ ، ۱۴:۴۹
حمید راحت حق

USDJPY

USDJPY currency pair trend

https://bayanbox.ir/view/5558277526790250642/shutterstock-1387304030-640x384.jpg


The short-term trend of the US dollar against the Japanese yen is neutral. The USDJPY pair is in the downtrend channel starting from 111.71. Hence, we can expect a deep downward movement from the market. If USDJPY falls below 103.31, it could prepare for a reversal to the 102.58 price floor. However, from the buyers' point of view, the break of 104.39 and the downtrend channel will mark the end of the downtrend starting from 111.71 and can push the USDJPY to the resistance of 105.67.

۰۶ بهمن ۹۹ ، ۱۵:۳۸
حمید راحت حق

EURUSD

EURUSD pair trend

https://bayanbox.ir/view/1745704217118543344/EURUSD.png


The short-term trend of the Euro against the US Dollar is up to a slight resistance of $ 1,2222. The break of this resistance could push the EURUSD pair to the high of $ 1,2348. However, from the traders' point of view, if EURUSD falls below the support of $ 1,2052, it could indicate the entry of the currency pair into the correction phase starting from the rate of $ 1,2348. In this case, the short-term trend of EURUSD will fall to $ 1.1887 at the correction of 61.8% Fibonacci.

۰۶ بهمن ۹۹ ، ۱۵:۳۵
حمید راحت حق

GBPUSD

GBPUSD currency pair trend

https://bayanbox.ir/view/5061091853659398002/shutterstock-1308280261.jpg


The short-term trend of the British pound against the US dollar is neutral. However, as long as the $ 1,3518 support remains in place, we can expect another uptrend. A break of $ 1,3745 could boost the GBPUSD short-term trend and extend the uptrend from $ 1,1409 to the 61.8% Fibonacci retracement at $ 1,3956. From the sellers' point of view, if the GBPUSD currency pair falls below $ 1.3518, it will indicate the formation of a short-term price peak. A downward divergence is seen in the four-hour MACD indicator. If this divergence works, the short-term market trend will decline.

۰۶ بهمن ۹۹ ، ۱۵:۲۵
حمید راحت حق