صفحه اصلی تقویم اقتصادی تحلیل رمزارزها (Cryptocurrency) تحلیل طلا (Gold) تحلیل فارکس (Forex) ارتباط با من درباره من
سایت تحلیل بورس، فارکس و ارز دیجیتال حمید راحت حق| Rahathagh.ir

اخبار و تحلیل نموداری و تکنیکالی بازارهای مالی دنیا اعم از بازار بورس داخلی، بازار فارکس، بازار طلا و بازار ارز دیجیتال و رمزارزها و روانشناسی بازار

Weekly analysis of the global Gold Saturday , February 20

Weekly analysis of the global Gold Saturday , February 2

https://bayanbox.ir/view/4164295542326912606/200728-gold-bar-%D8%B1%D8%A7%D8%AD%D8%AA-%D8%AD%D9%82.jpg
The GOLD price of gold yesterday experienced an upward trend from the lowest level in the last seven months. Gold traded lower at $ 1,760 and rose to $ 1,790 after the official start of trading in the United States.
Gold ended the week at $ 1,780 and fell 2.35% over the past seven days. This is the worst weekly gold performance since July.
After testing the support level of $ 1,765 to $ 1,770, the price of gold was able to start a corrective trend. Stabilizing the price below this level will cause a downward trend.
Similarly, the stabilization of the price above the level of $ 1,790 can be considered a sign of the possibility of an uptrend for gold.
However, the correction in the price of gold seems limited and there is a possibility that the price will fall. Investors' risk appetite has increased as Treasury bond yields have risen. On Friday, the 10-year yield on US Treasury bonds reached a one-year high of 1.35%.

Technical levels
Last price of the day: $ 1783.54
Daily fluctuations: 8.80
Daytime fluctuations (٪): 0.5
Starting price: $ 1774.74
Trends
20-day moving average: $ 1826.92
50-day moving average: $ 1854.34
100-day moving average: $ 1865.24
200-day moving average: $ 1858.94
Levels
Yesterday's highest price: $ 1789.76
Lowest price yesterday: $ 1768.46
Last week's highest price: $ 1855.5
Last week's lowest price: $ 1807.86
Last month's highest price: $ 1959.42
Last month's lowest price: $ 1802.8
Fibonacci 38.2. Daily: $ 178.62
Fibonacci 61.8. Daily: $ 1776.6
Pivot S1 Daily: $ 1765.55
Pivot S2 Daily: $ 1756.35
Pivot S3 Daily: $ 1744.25
Pivot R1 Daily: $ 1786.85
Pivot R2 Daily: $ 1798.95
Pivot R3 Daily: $ 1808.15
۰۲ اسفند ۹۹ ، ۱۵:۳۵
حمید راحت حق

An overview of the cryptocurrency market today Saturday , February 20

An overview of the cryptocurrency market today Saturday , February 20

https://bayanbox.ir/view/8943225726436269878/hit-20-2%D8%B1%D8%A7%D8%AD%D8%AA-%D8%AD%D9%82.jpg

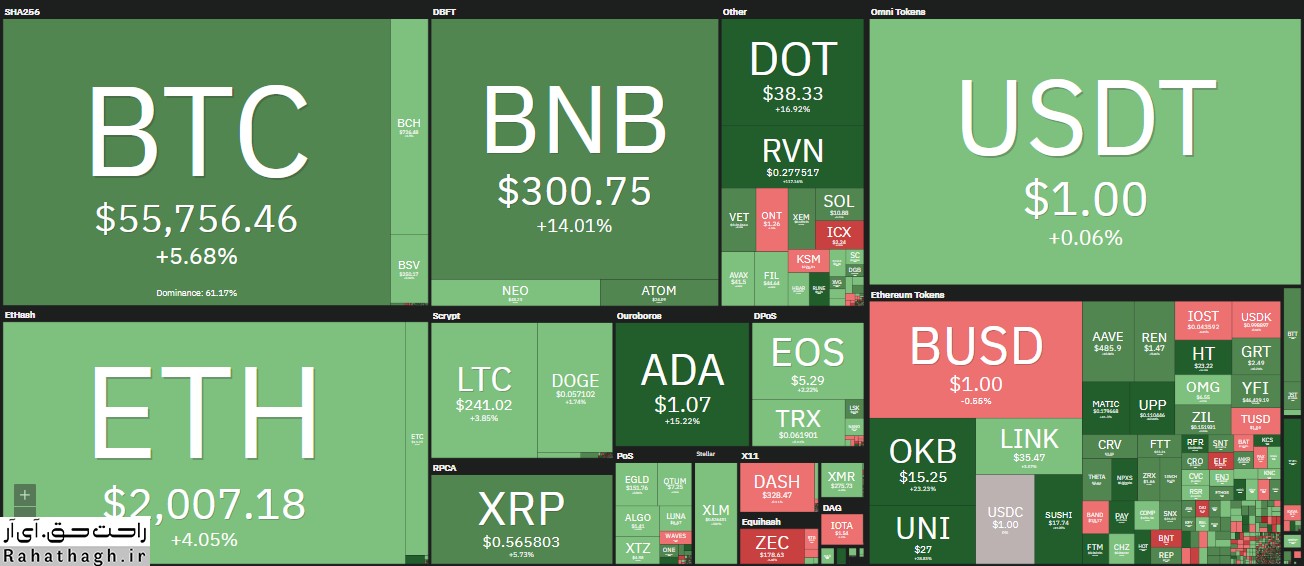
While the price of Bitcoin (BTC) rose above $ 55,300 in the morning trading session, for the first time the market value of this currency exceeded $ 1 trillion. The breakdown continued throughout the day, with BTC hitting an all-time high of $ 56,368 in the past hour.

Now that Bitcoin has established itself as a trillion-dollar asset among financial giants such as Amazon, Apple and Google, older banks have become more interested in providing cryptocurrency retention services to their customers.

At the time of writing, Bitcoin is trading at $ 55,847.
Several top altcoins on the market have joined the BTC move. One of them is ETH, which set a new record in its history by entering the $ 2,000 channel. The REN token continued its impressive performance, rising 60 percent to $ 1.80. Baines Coin (BNB) has reached its highest price at $ 348.72 with the growing influence of Bainance Smart Chain (BSC).

This parabolic rally made BNB the third largest currency in terms of market value.

Other DeFi-related projects such as PancakeSwap (CAKE) and Venus (VXS) are among BSC's top attractions, trading at $ 20.62 and $ 101.50, respectively, which are new records.

There is currently no sign of a momentary decline in the uptrend that has pushed up the price of Bitcoin and other altcoins. Recent data show that in 2021, bitcoin price increases will begin more on weekends, and many analysts believe that this digital asset could reach $ 60,000 by the end of the week.

While the price of ether (ETH) has remained stable at around $ 2,000, there are rumors that the currency will rise further as corporate investors show great interest in returns through deposits in Eth2 as well as participation in Defy's growing segment. Both of these factors are the driving force behind the growing demand for ether and the consequent increase in its price.

۰۲ اسفند ۹۹ ، ۱۴:۱۷
حمید راحت حق

Review of Apple Stock Performance (AAPL) on the last trading day

Review of Apple Stock Performance (AAPL) on the last trading day

https://bayanbox.ir/view/53504180221414045/The-Future-Of-Apple-%D8%B1%D8%A7%D8%AD%D8%AA-%D8%AD%D9%82.jpg
Shares of Apple Corps (NASDAQ: AAPL) closed up 0.12% at $ 129.87 on the last trading day. The overall stock market followed an uptrend on Friday, with the Nasdaq Composite Index (COMP) rising 0.07% to 13,874.46. The Dow Jones Industrial Average (DJIA) closed unchanged at 31,494.32. Friday's uptrend offset the three-day decline in Apple shares. On the other hand, Apple shares closed $ 15.22 lower than their highest 52-week high ($ 145.09) on January 25.
Let's compare the performance of some of Apple's competitors. For example, the stock of Microsoft (MSFT) fell 1.16% to $ 240.97. Alphabet (GOOGL) fell 0.81% to $ 2,088.81 and IBM fell 1.44% to $ 118.99.
Apple stock traded at $ 86.8 million, down $ 16.5 million from its 50-day moving average ($ 103.3 million).

۰۲ اسفند ۹۹ ، ۱۳:۱۳
حمید راحت حق

Fundamental analysis of the Forex market and the European stock market Friday, February 19

Fundamental analysis of the Forex market and the European stock market Friday, February 19

https://bayanbox.ir/view/3760427336903838692/businessman-using-laptop-%D8%AD%D9%85%DB%8C%D8%AF-%D8%B1%D8%A7%D8%AD%D8%AA-%D8%AD%D9%82.jpg

European stock indices have halted the longest downward trend since October. Investors are evaluating the vague financial statements of corporations. Meanwhile, the price of crude oil has fallen.
The Stoxx Europe 600 stock index has reopened from a positive range. The S&P 500 futures index has not changed significantly and the Nasdaq 100 futures index (NASDAQ) has grown. However, there are no clear risk flows in the market. But the US dollar has weakened in the Forex market. Meanwhile, the yield on 10-year US Treasury bonds has returned to 1.3 percent and the main focus of investors is on the financial statements of corporations. From a fundamental analysis point of view, the growth of Treasury yields should be to the detriment of the stock market, but this has not yet happened. There is a misconception in the financial markets. Many market participants assume that interest rates will remain close to zero percent forever. But given the growth in long-term bond yields, this seems to be a misconception. This means that stock market investors may face this fact in the near future and exit the market.
Recent economic data show that the global economic recovery is weak and fragile. The UK retail index has fallen sharply, contrary to market expectations. In the crude oil market, the price of light crude oil (WTI) has fallen below $ 60. The US government has stated that it intends to negotiate with the Iranian government. Oil investors believe that easing tensions between Iran and the United States could increase global crude oil supplies.

۰۱ اسفند ۹۹ ، ۱۵:۴۲
حمید راحت حق

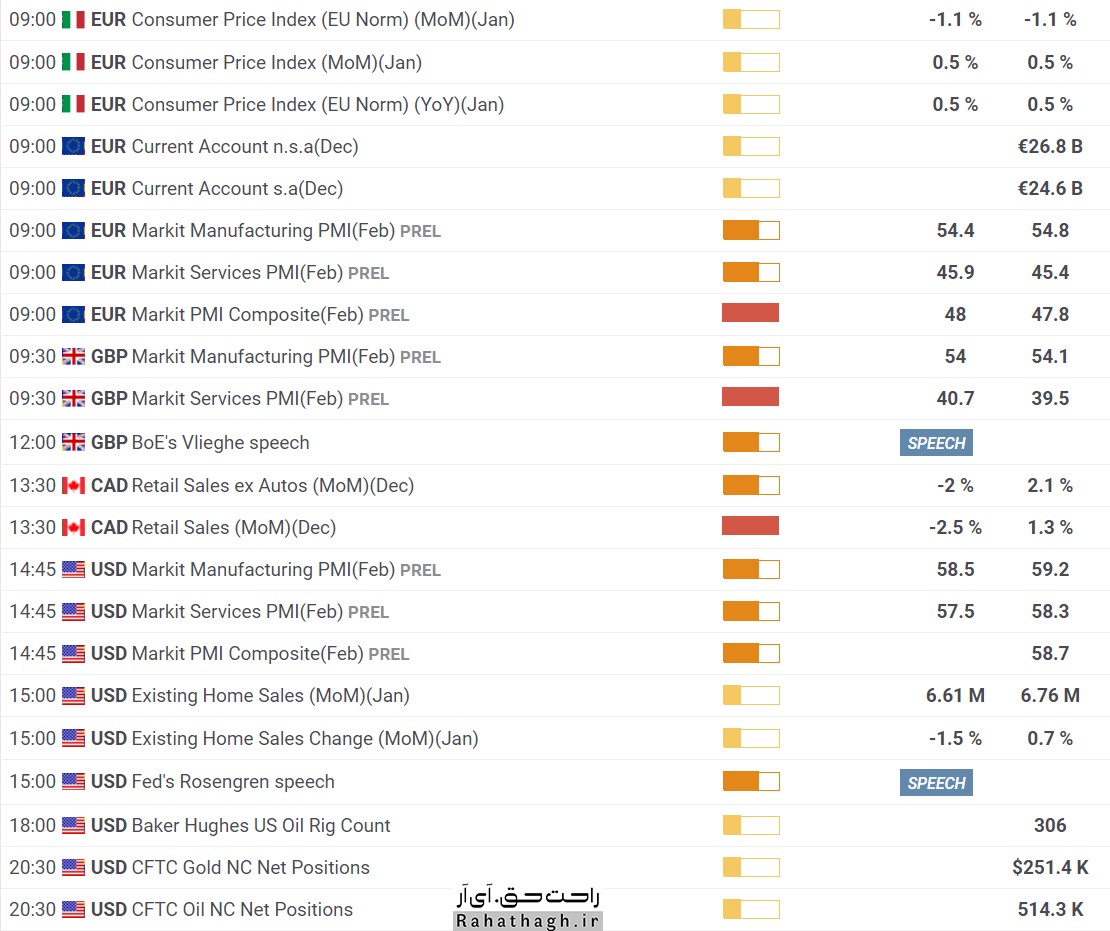
Economic calendar Friday, February 19

Economic calendar Friday, February 19

https://bayanbox.ir/view/1528808475830694721/eco19-2-1%D8%B1%D8%A7%D8%AD%D8%AA-%D8%AD%D9%82.jpg https://bayanbox.ir/view/5576668588650539795/eco19-2-2%D8%B1%D8%A7%D8%AD%D8%AA-%D8%AD%D9%82.jpg https://bayanbox.ir/view/7293420017617151634/eco19-2-3%D8%B1%D8%A7%D8%AD%D8%AA-%D8%AD%D9%82.jpg

۰۱ اسفند ۹۹ ، ۰۹:۰۰
حمید راحت حق

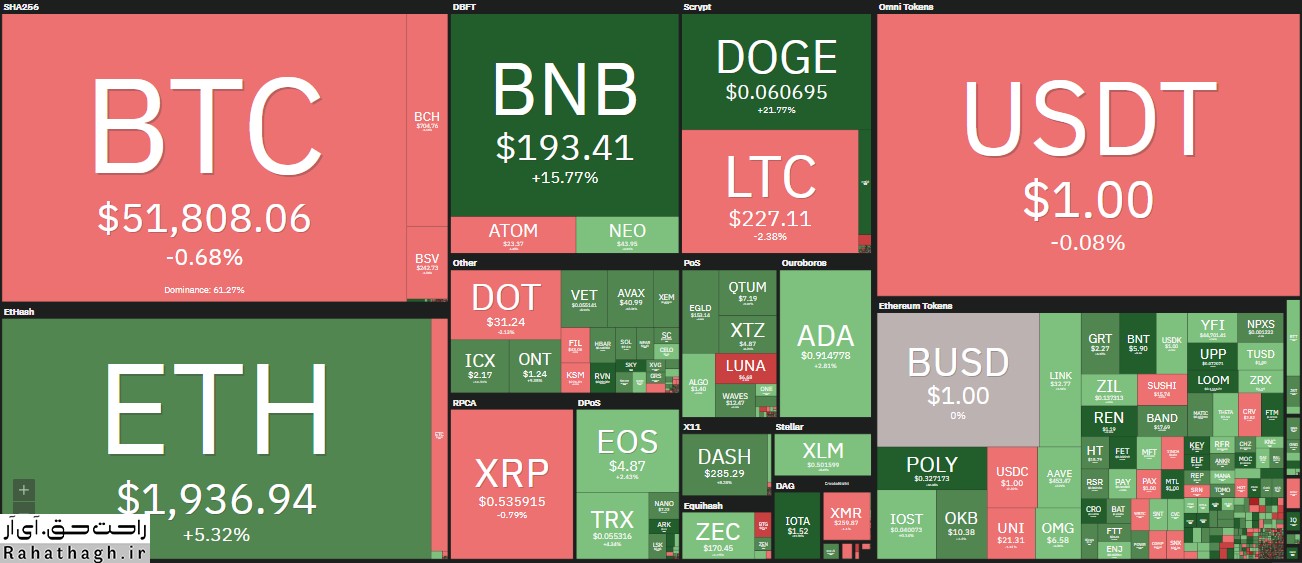
An overview of the cryptocurrency market Friday, February 19

An overview of the cryptocurrency market  Friday, February 19

https://bayanbox.ir/view/5477792946733890155/bit%D8%B1%D8%A7%D8%AD%D8%AA-%D8%AD%D9%82.jpg
Over the past 24 hours, we have seen new records being recorded among cryptocurrencies. Bitcoin climbed above $ 52,500 with Atrium and Bainance Coin breaking new records.
A new record for Bitcoin

The currency resumed its uptrend after Bitcoin fell to $ 46,000 on Monday. As reported in the early days of this week, BTC entered the $ 50,000 channel for the first time and has not fallen significantly since. In the last 24 hours, Bitcoin reached its last record at $ 52,600 (on Bitstamp), entering the $ 52,000 area, and continued to rise.

With this record, BTC was only $ 20 billion away from reaching a market value of $ 1 billion. However, after a slight increase yesterday, with the addition of altcoins to this uptrend, bitcoin dominance has once again decreased to 61%.

New records for other altcoins

As mentioned above, most of the replacement coins in the last 24 hours were in line with the upward trend in the market. Atrium is leading the way with a 6% increase. Binance Quinn also reached above $ 180 with its record breaking again. This asset has increased in price by about 350% since January 27 (February 28).

Polkadot (3%), Cardano (10%), Ripple (4%), Litecoin (6%) and Bitcoin Cash (1.5%) are also among the top 10 currencies in the market today.

The situation has been similarly high among lower market value altcoins. Bancor (40%), Venus (34%), Horizen (33%), PancakeSwap (33%), Phantom (26%) and Polygon (25%) are in the double-digit currency group.

Naturally, this overall price increase also means setting a new record in the total value of the crypto market. The market value of all encrypted assets approached $ 1.6 trillion. The index has risen more than $ 700 billion since mid-January.

۰۱ اسفند ۹۹ ، ۰۲:۲۶
حمید راحت حق

Rick Reader's special look at Bitcoin

Rick Reader's special look at Bitcoin

https://bayanbox.ir/view/8982704901674954710/50460d59-%D8%B1%D8%A7%D8%AD%D8%AA-%D8%AD%D9%82.jpg
Asset management giant BlackRock has turned its attention to investing in Bitcoin!

According to Rick Rieder, chief investment officer at asset management giant BlackRock, the company has turned to investing in bitcoin as a replacement for value storage.

Reader commented on BlackRock's interest in an interview with CNBC's Squawk Box on Wednesday morning. He said the asset management giant had taken steps in the field of cryptography, but did not elaborate.

Reader said that people's interest in bitcoin is growing because people are looking for an alternative to store value. He added: "My impression is that this technology has evolved and the regulations in this area have improved to some extent, because some people consider it as part of their portfolio, a factor that causes prices to rise. ”

According to Reader, BlackRock has not yet made any offers on Bitcoin, but since it has a lot of money, allocating part of it to Ramzars "makes sense." However, he remained skeptical that anyone should invest a portion of their assets in Bitcoin.

"I do not consider a number to be allocated, as it depends on the rest of the portfolio," he said. "

As previously reported, given BlackRock's budget, monitoring records indicate that the company is about to buy Bitcoin.

۳۰ بهمن ۹۹ ، ۱۳:۵۳
حمید راحت حق

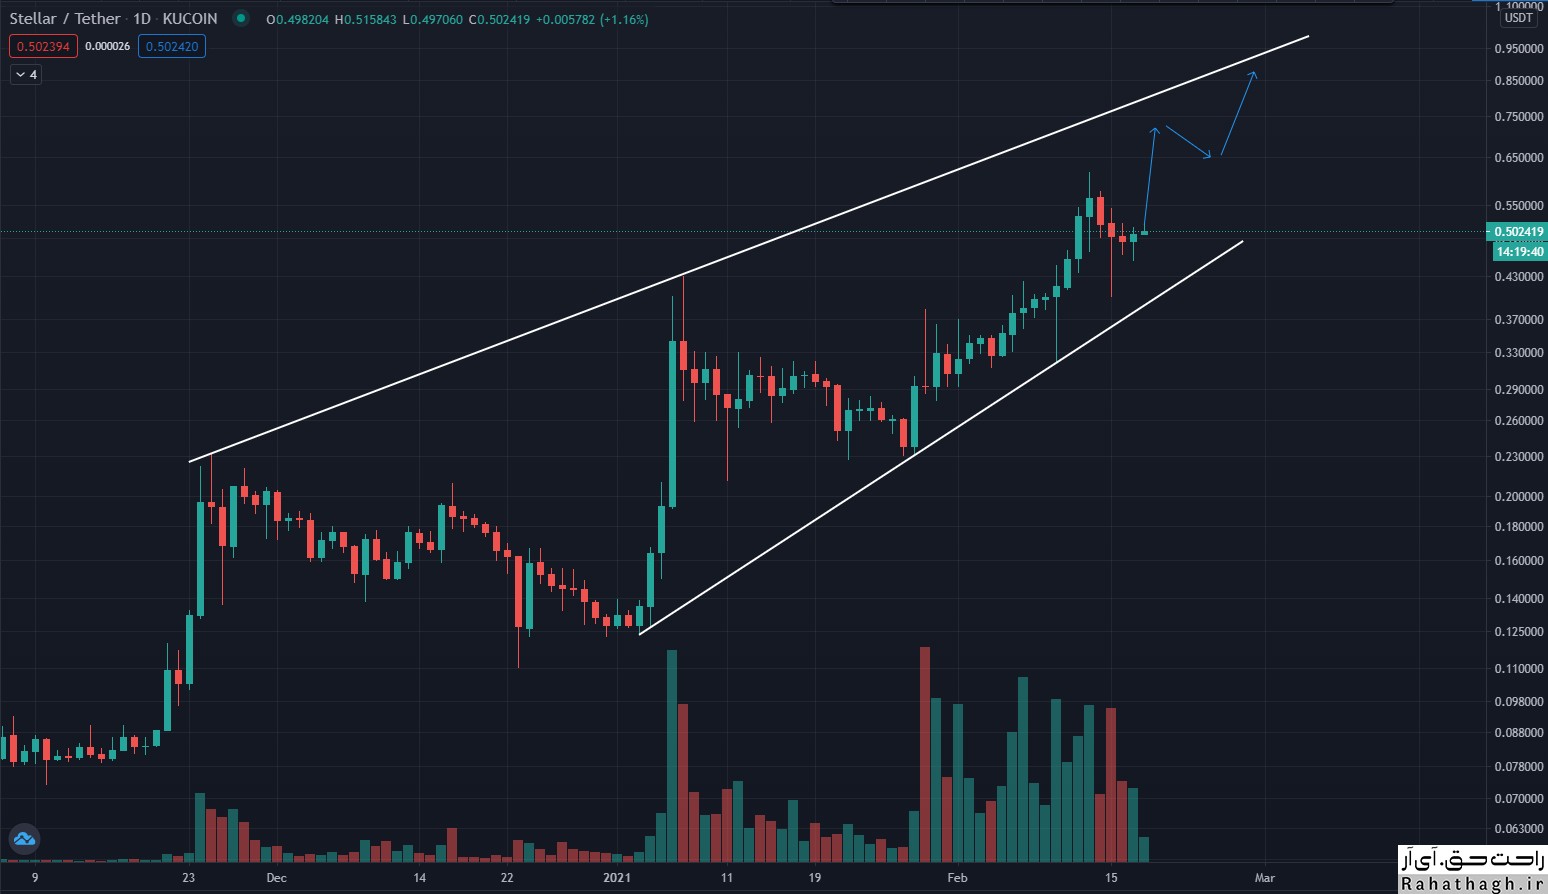
Stellar Analysis (XLM) Thursday, February 18

Stellar Analysis (XLM) Thursday, February 18

https://bayanbox.ir/view/3367066594993881535/stellar-%D8%B1%D8%A7%D8%AD%D8%AA-%D8%AD%D9%82.jpg
The strength of the upward trend in the price of Stellar digital currency has decreased to $ 0.465 after breaking the resistance level in April 2018. After that, the multi-year price ceiling was recorded at $ 0.61, but the market lost control over the buyers.
Currently, buyers are trying to stabilize the price above the level of $ 0.465 in order to reach the highest price level at $ 1.05.
The recent uptrend has made it easier to reach the historic price record of $ 1.05. The price is currently fluctuating in the range of $ 0.5 and is about 125% away from its record.

On the other hand, the MACD indicator, which is used to determine the entry and exit points, predicts the continuation of the uptrend. The significant distance between the MACD line and the signal line, as well as the fact that the MACD line is higher than the signal line, show us that the price trend is positive.

The RSI indicator also shows a negative price divergence in the four-hour time frame.

This divergence indicates the possibility of price correction. Breaking support levels of $ 0.5 and $ 0.465 are needed to form this correction and a downtrend.

۳۰ بهمن ۹۹ ، ۱۳:۲۳
حمید راحت حق

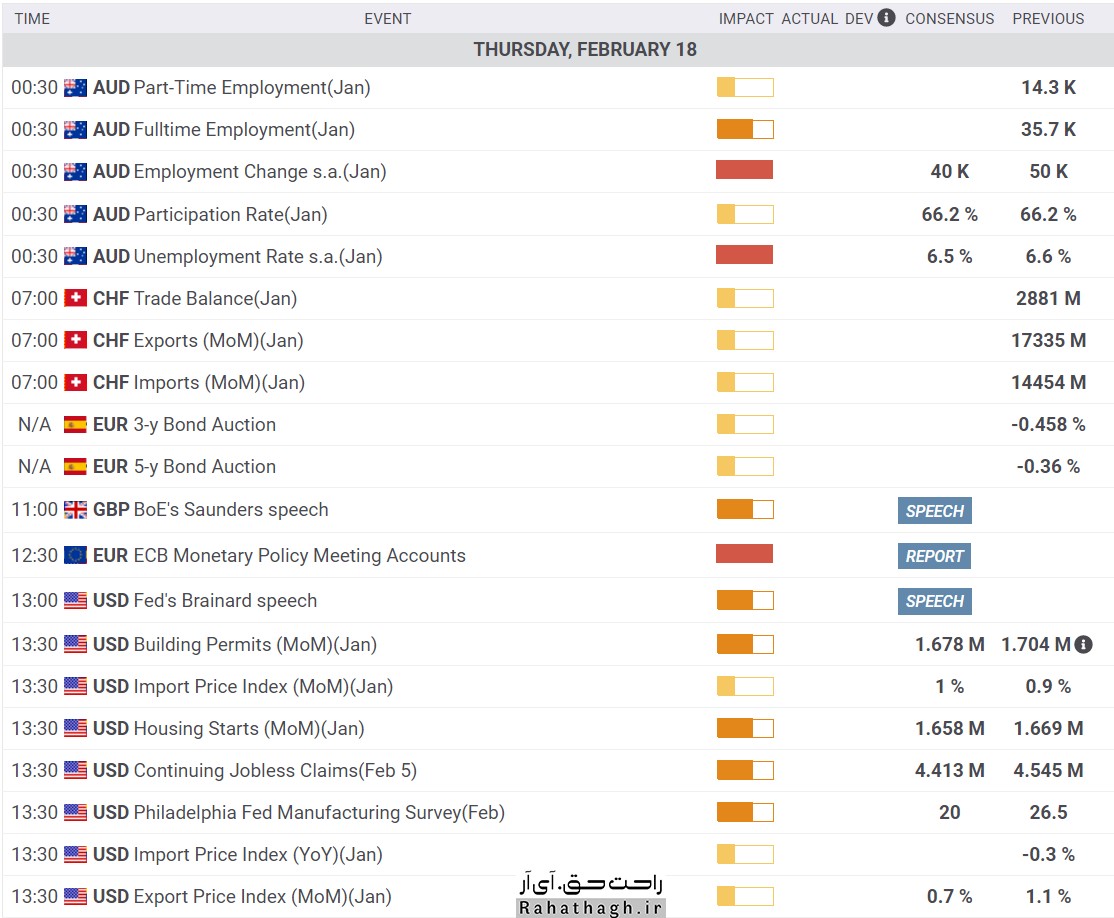
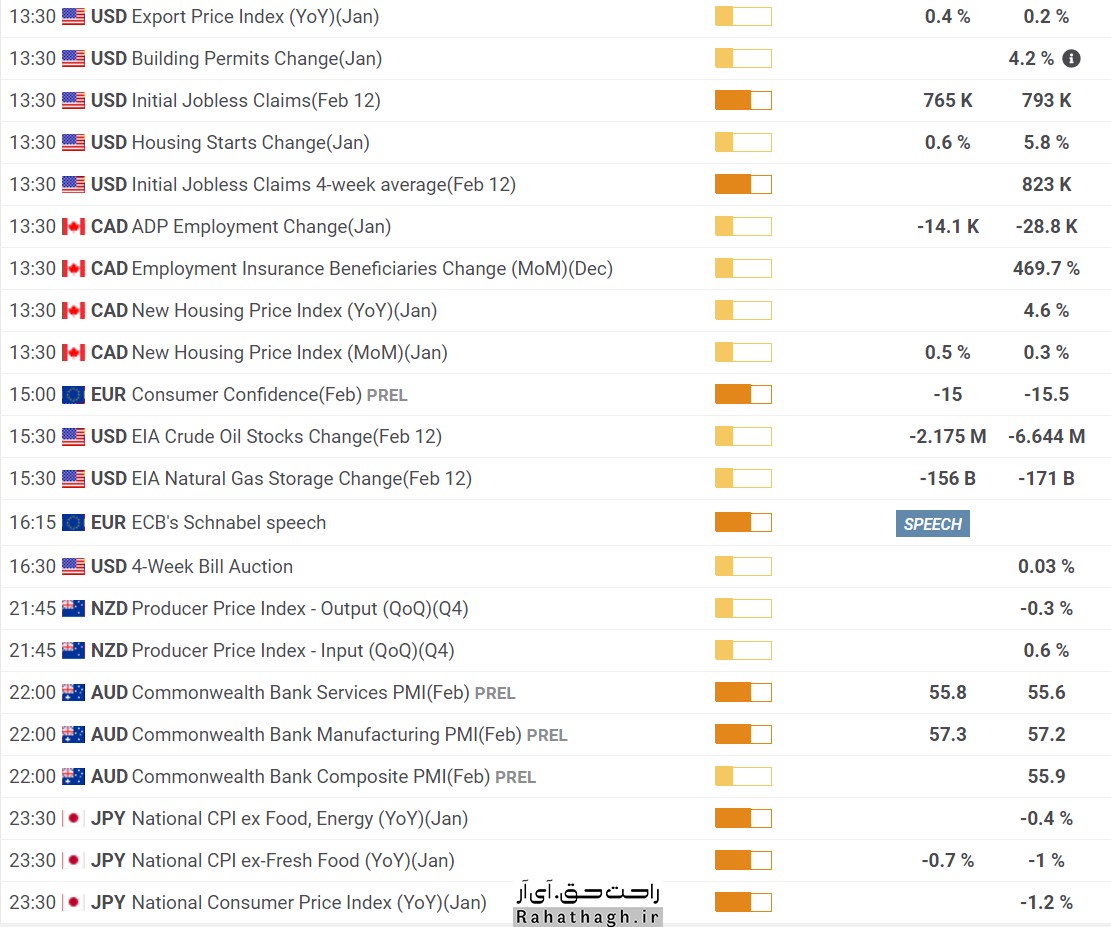
Economic calendar Thursday, February 18

Economic calendar Thursday, February 18

https://bayanbox.ir/view/7562381722438757144/eco18-2-1%D8%B1%D8%A7%D8%AD%D8%AA-%D8%AD%D9%82.jpg https://bayanbox.ir/view/543801665923420342/eco18-2-2%D8%B1%D8%A7%D8%AD%D8%AA-%D8%AD%D9%82.jpg

۳۰ بهمن ۹۹ ، ۰۹:۰۰
حمید راحت حق

Bitcoin Analysis (BTC) Wednesday, February 17

Bitcoin Analysis (BTC) Wednesday, February 17

https://bayanbox.ir/view/5541391780580057507/BTC-%D8%B1%D8%A7%D8%AD%D8%AA-%D8%AD%D9%82.jpg
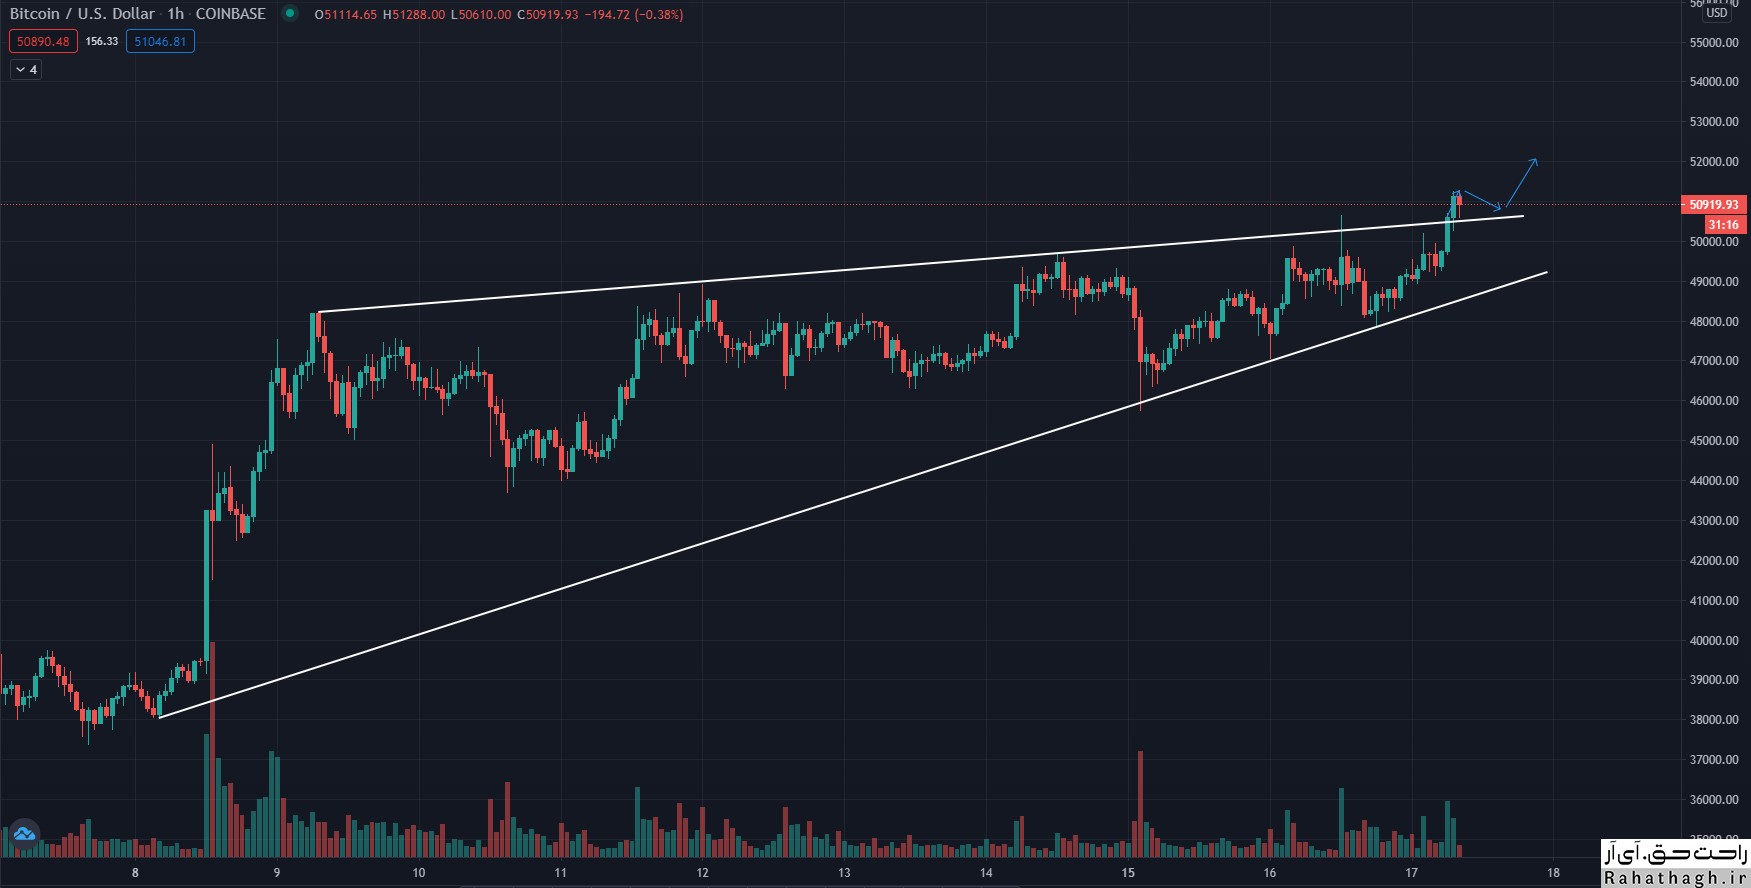
Bitcoin prices regained their uptrend and broke the $ 50,000 resistance. BTC is maintaining a profit and seems to be moving further towards 52000.

Expand profitability

The price of bitcoin finally managed to cross the $ 50,000 resistance area. BTC climbed above the $ 50,200 and $ 50,500 levels and traded at the new $ 50,600 level before correcting the downtrend. There was a Sharpe correction below the $ 50,000 level. The price even fell below the $ 49,000 support level. However, the cows were able to stay close to the $ 48,000 area and the simple 100-hour moving average. A floor formed near the level of $ 47,819 and the price is currently rising.

Bitcoin above the Fibonacci retracement level trades 50% down from the $ 50,000 to $ 47,819. There was also a break above the key contraction triangle with resistance near 49,500 on the BTC / USD chart.
 The price trades well above $ 50,000 and is completely above the simple moving average of 100 hours and is testing the Fibonacci retracement level of 76.4% downward from the $ 50,000 swing ceiling to the $ 47,819 floor.

It seems that the upward trend of the price towards the ceiling of $ 50,600 will continue. A further climb could easily push the price towards the 51000 level. The next key resistance is at $ 52,000.

BTC fall again?

If Bitcoin fails to stay above the $ 50,000 and $ 50,200 levels, a bearish correction will occur. Initial support is near the $ 49,500 level and the broken triangle trend line.

A break below $ 49,500 could push the price towards $ 48,000 support. The simple 100-hour moving average is also set to support close to $ 48,000.

 Technical indicators:

Indicator of moving average convergence Hourly divergence in the cattle area.

The hourly relative strength index is currently above the 50 level.

Main support levels: $ 49,500 and then $ 49,000.

Main resistance levels: $ 50,000, $ 51,000 and $ 52,000.

۲۹ بهمن ۹۹ ، ۱۲:۰۲
حمید راحت حق