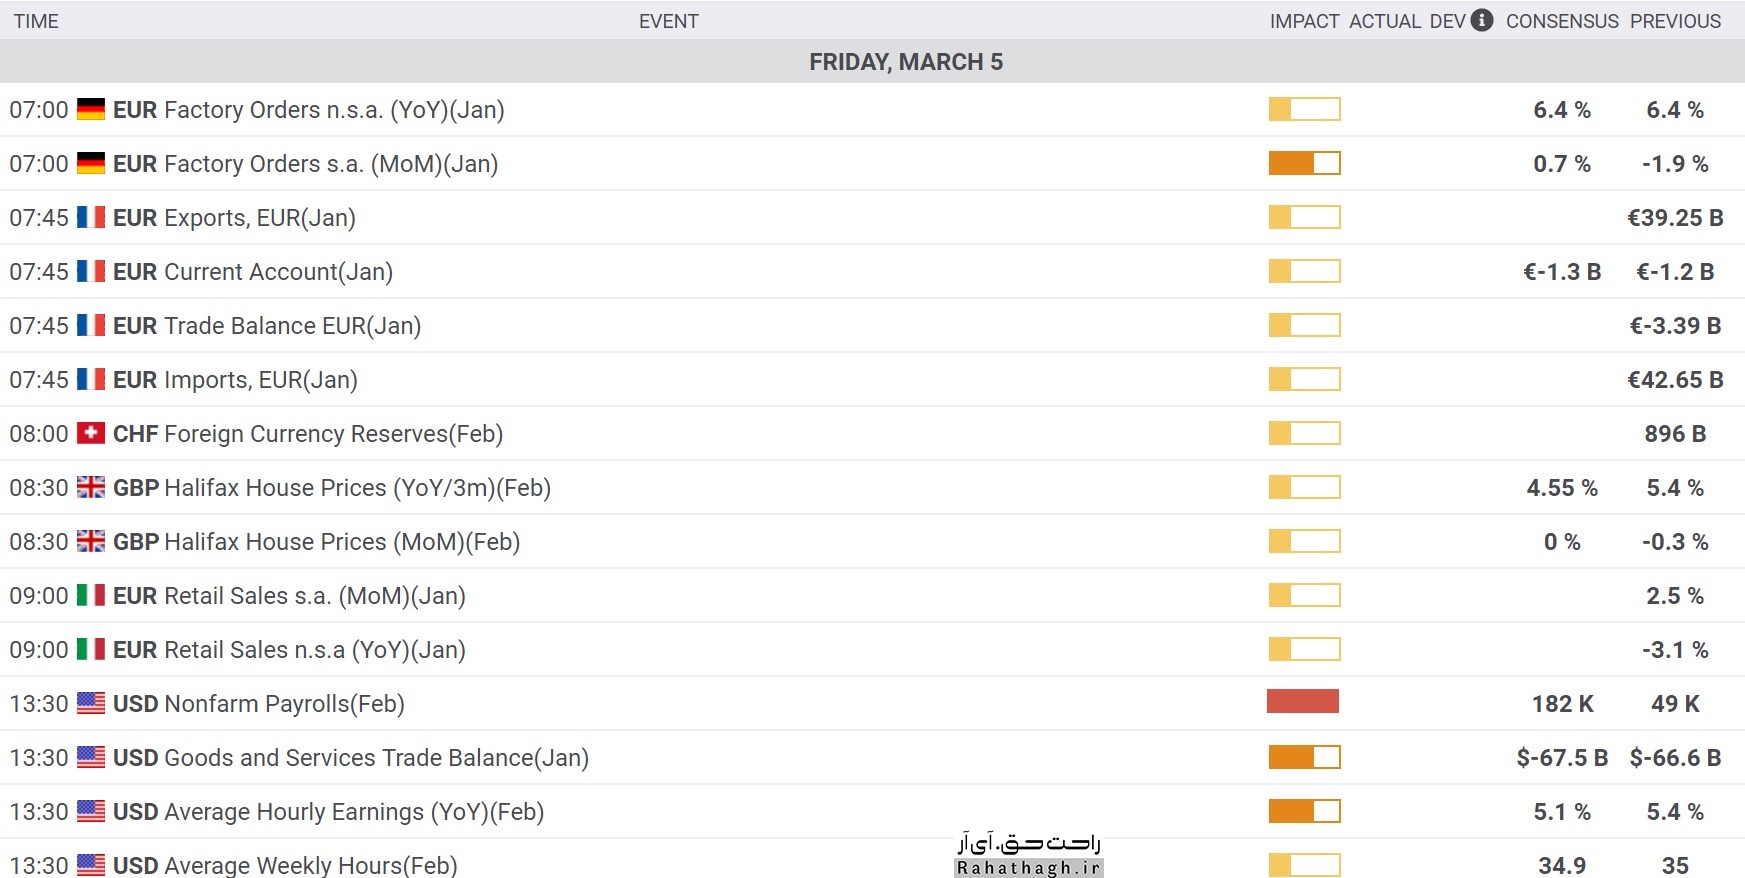
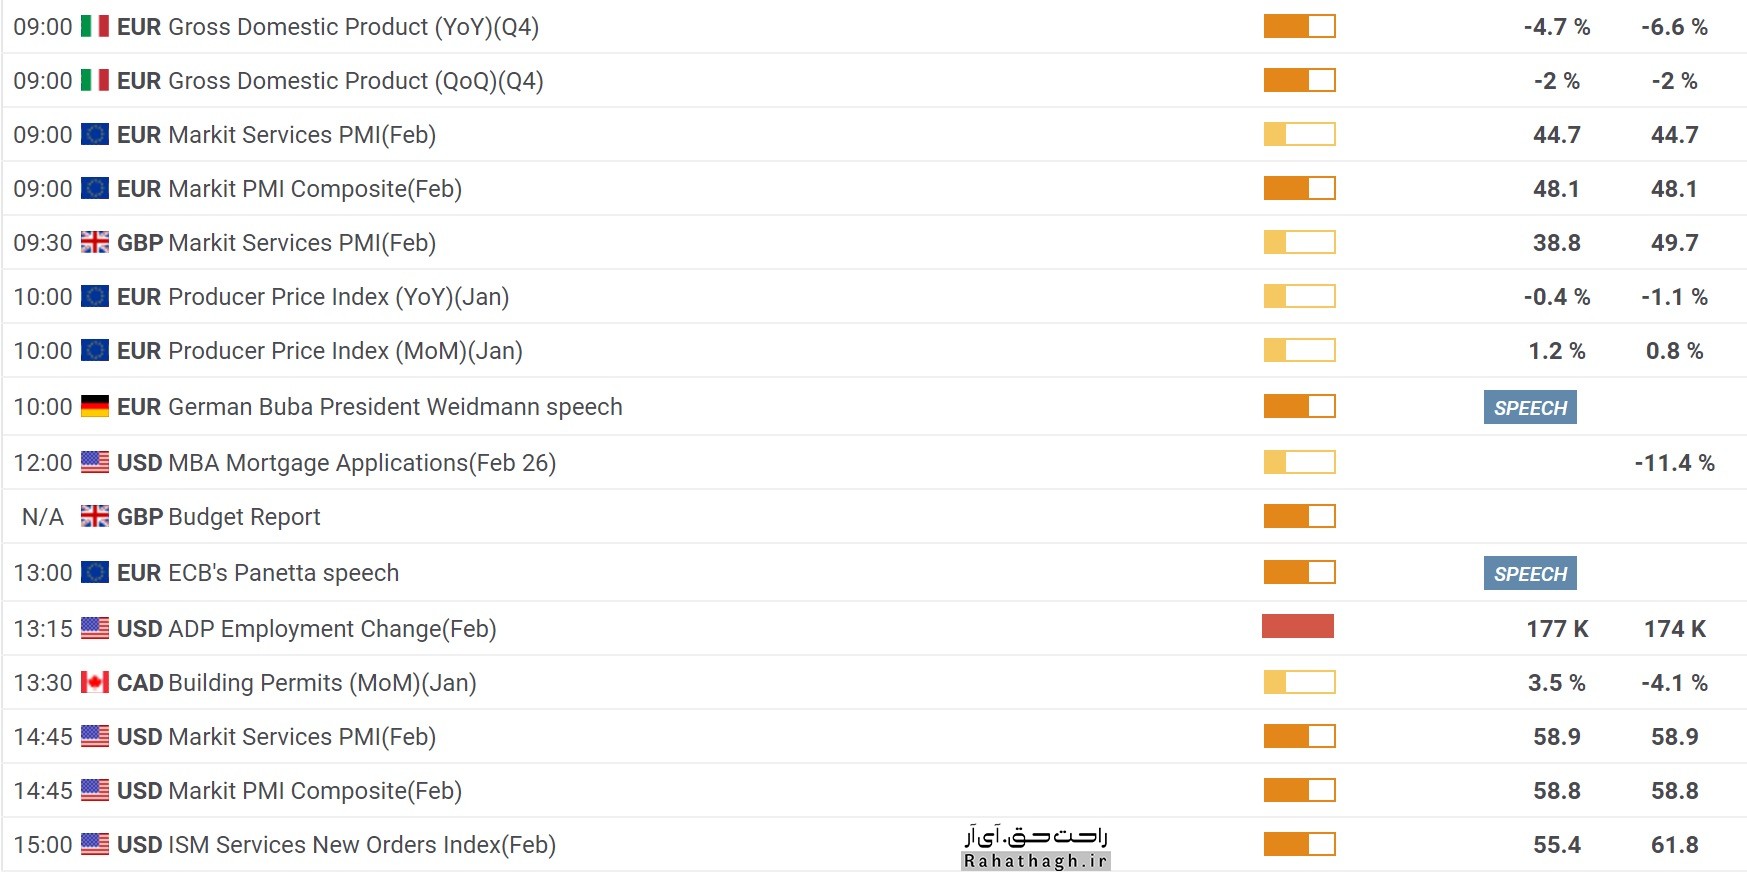
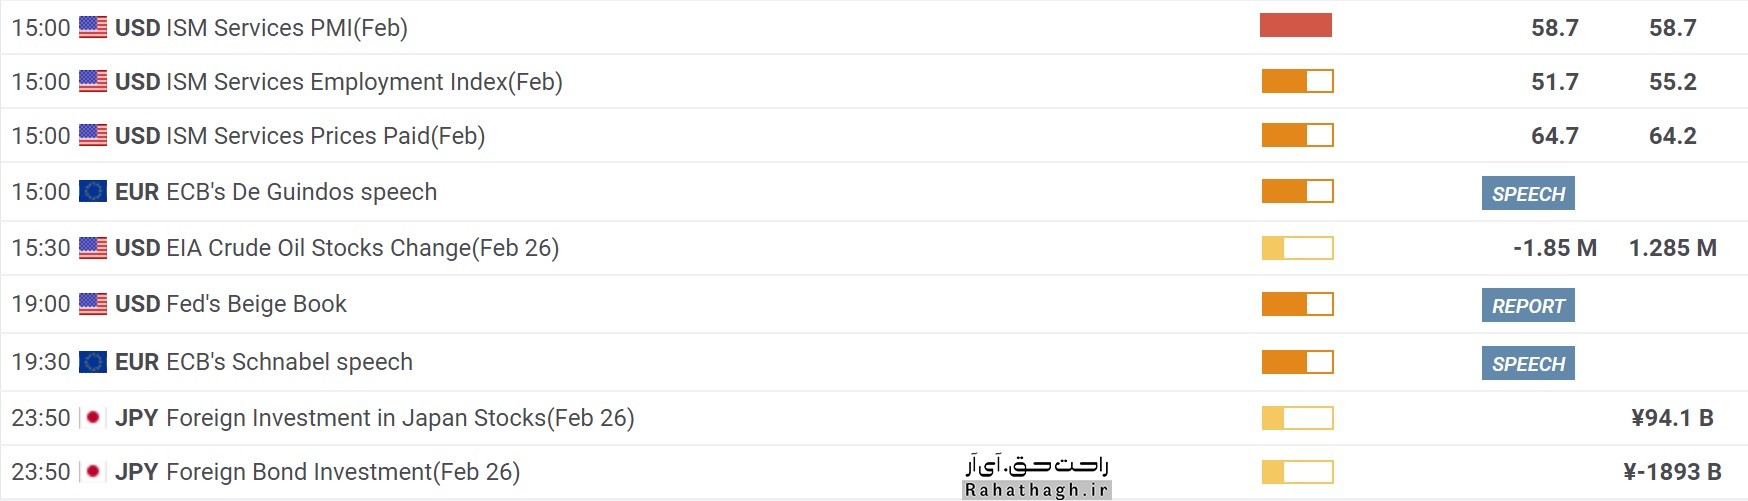
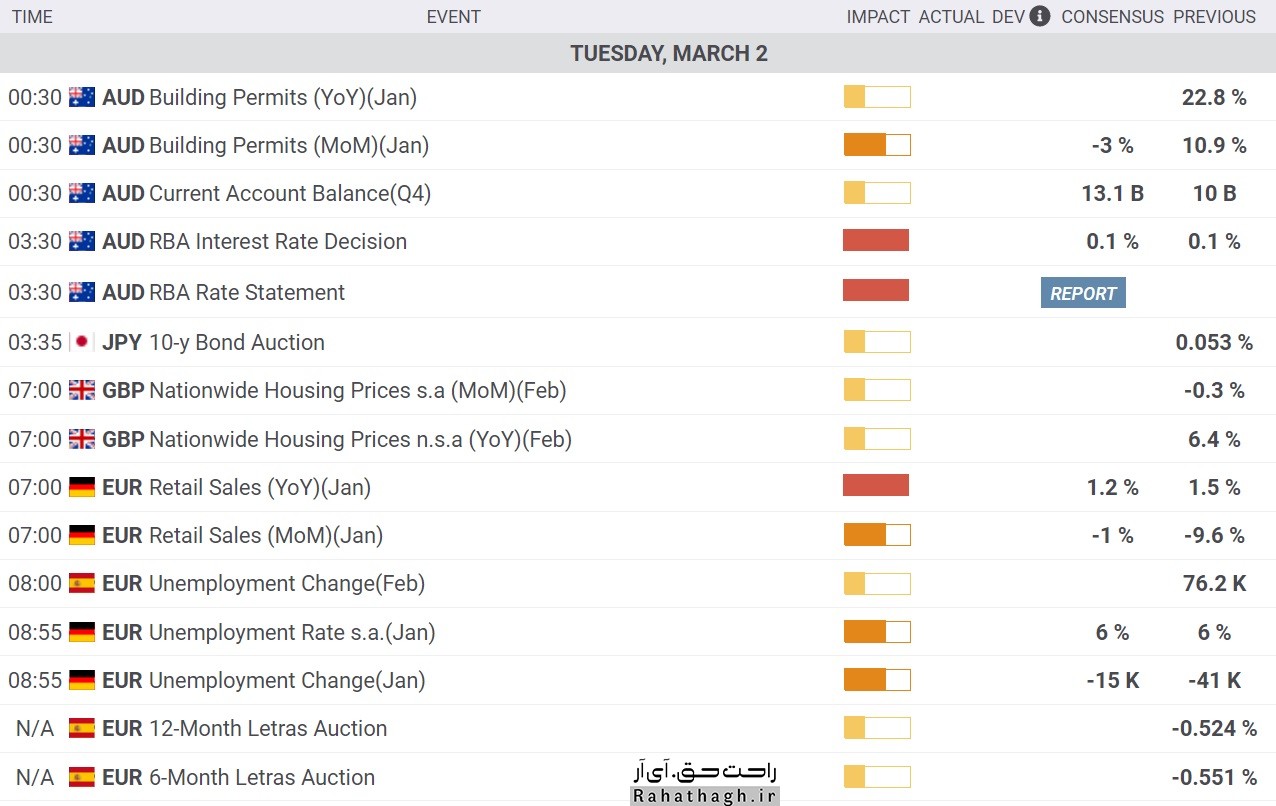
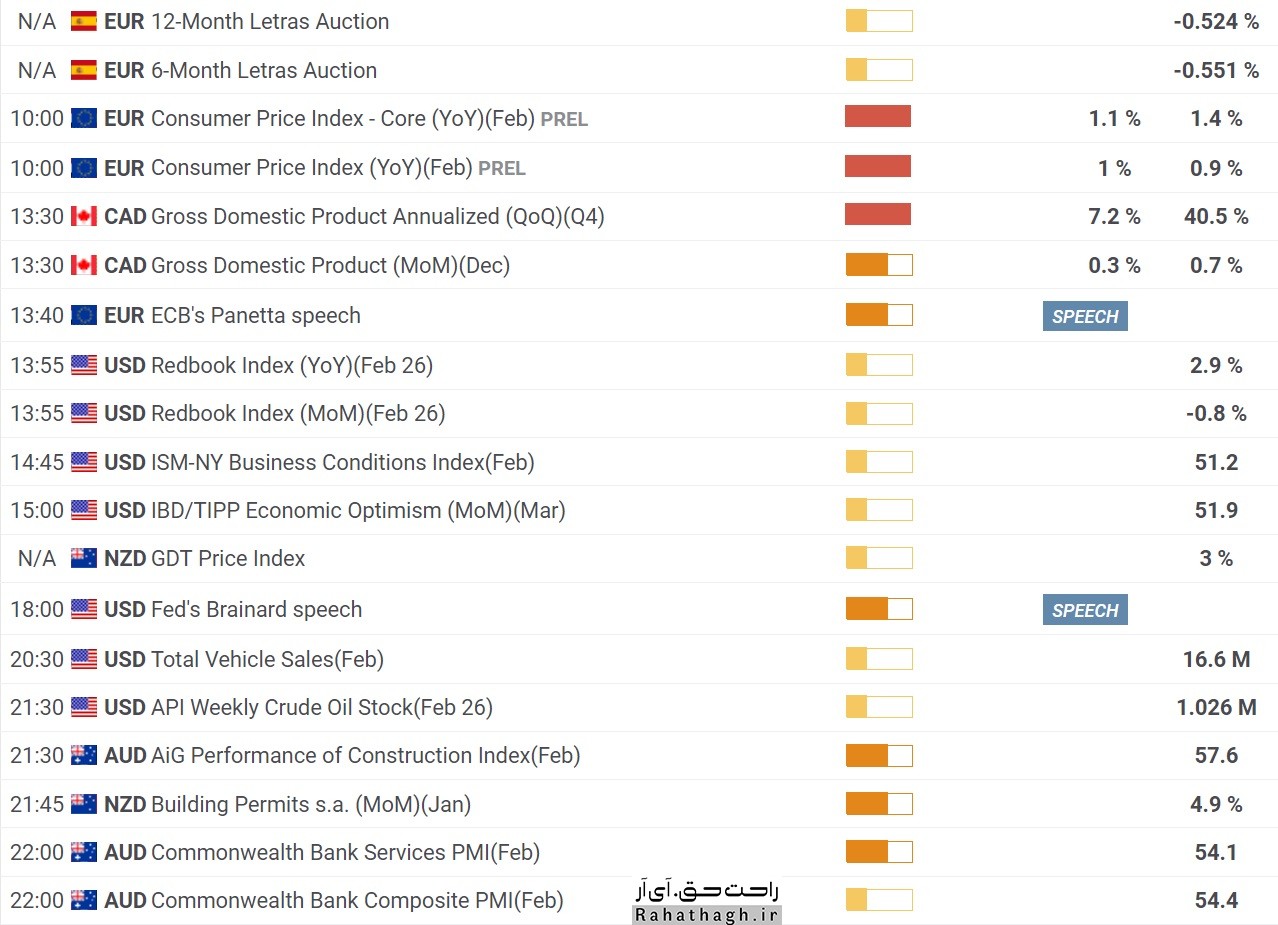
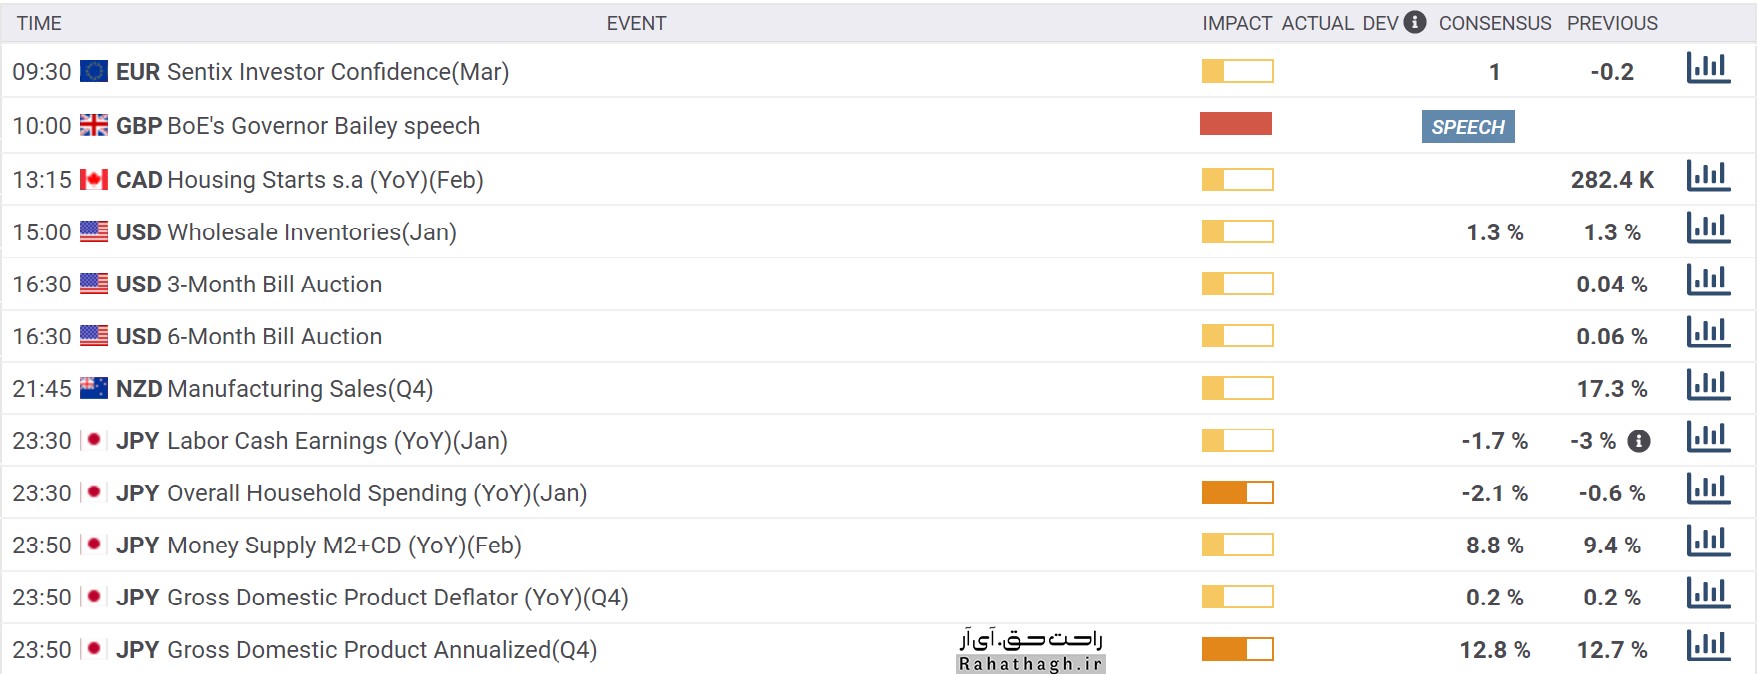
Economic calendar Monday, March 8

17% of the world's bitcoin reserves have not been moved for more than 7 years

The Unfolded database announced yesterday that a high percentage of the world's bitcoins have not been traded for more than seven years. This data is extracted by the "HODL Wave" indicator, which is a practical tool in the analysis of chain data on the Glassnode website.
This indicator tracks the time between bitcoin transactions, giving an in-depth look at how long that bitcoin has been stored at an address before being moved across the network. The indicator is named after a popular post on the Bitcointalk forum that told bitcoin holders in 2013 to hodl their bitcoins and not sell them. .
The HODL Wave indicator shows that more than 3.3 million bitcoins have not been transferred on the network for more than 7 years. This amount of bitcoins is equal to 17.87% of the total bitcoins in circulation in the world and their value is estimated at the current price of bitcoins of about 160 billion dollars.
These bitcoins do not necessarily belong to whales. Large quantities of these bitcoins have been lost in recent years due to accidental deaths or password forgetfulness.
"Many of these wallets belong to people who bought or mined bitcoins at very low prices and then extracted them," said YIELD App CEO Tim Frost in a note. They are lost and do not have access to it. "Until 2013, many saw bitcoin as a monopoly currency and had no vision for the future and what bitcoin could become."
Last year, a report was published by the Chainalysis website that reported a slightly higher number of bitcoins lost in smaller timeframes. It reported that approximately 3.7 million bitcoins in the world (20% of circulating bitcoins) had not been traded for 5 years. The same report also noted that 3.5 million bitcoins worldwide are actively traded on the open market, while 11.4 million bitcoins are held as long-term investments in Chinese blockchain addresses.
However, Tim Frost believes that it is possible to provide access to these bitcoins to their owners. "These wallets are like hammers that can hit the market at any moment."
But this issue can also be traced. Glassnode has another indicator called Coin Days Destroyed that moves upwards when an old bitcoin is moved over the network.
As we can see in the chart above, in late 2018 and 2019, we see that the old currencies in the network have been transferred to the network for the first time and after a long time. We see such activity now and in 2021, but the level of these activities is almost the same and has not increased.
Return of gold ounces from key support

On November 30, 2020, the global ounce of gold, after hitting $ 1764, started moving up to the price of $ 1959.36. Gold traders entered the market around this rate, which resulted in the beginning of a new downtrend. Recently, gold ounce price movements have been restricted between the two downtrend lines. In today's trading, the market is again supported by the price of $ 1708.64 and the price of gold has risen. If the market continues to return positively from $ 1708.6 and the ounce of gold breaks the downtrend line, one can expect the market to move to the rate of $ 1742.21, the moving average of 50 and the resistance of $ 1767.
But if the ounce of gold definitively breaks the 1708.64-1700 range, it could start a new downtrend to support at $ 1675 and then $ 1650.
Dogecoin Analysis (DOGE) Wednesday, March 4
Following the fall of the Dogecoin digital currency this month, buyers are trying to form a corrective trend. However, we are seeing a slight volatility in the Dogecoin price.
On the other hand, by drawing two trend lines in a four-hour time frame, a regular triangle pattern is formed. If this pattern is broken from any side, an ascending or descending trend will be formed.
If the pattern breaks, the Dodge Quinn will rise 38% to $ 0.07. However, buyers should be able to push the price above the levels of the 100 and 200 moving average indicators in the four-hour time frame.
Another factor that has increased the probability of price growth is the uptrend of the MACD indicator. According to this indicator, the MACD line has reached the top of the signal line. This triggered a buy signal by the MACD.
On the other hand, the number of new daily addresses that are added to the network of this digital currency has now reached 42,000 after reaching 33,000 on February 23rd. The growth and expansion of the Dogecoin network is an important fundamental factor for price growth.
On the other hand, looking at the four-hour time frame, we see that the 50 moving average indicator in the range of $ 0.05 plays the role of a support. If the price penetrates below the level of this indicator, the price will fall to the downtrend line of the triangle pattern, and if this level is broken, we will see a strong downtrend to the target of $ 0.03.
An overview of the cryptocurrency market Wednesday, March 3
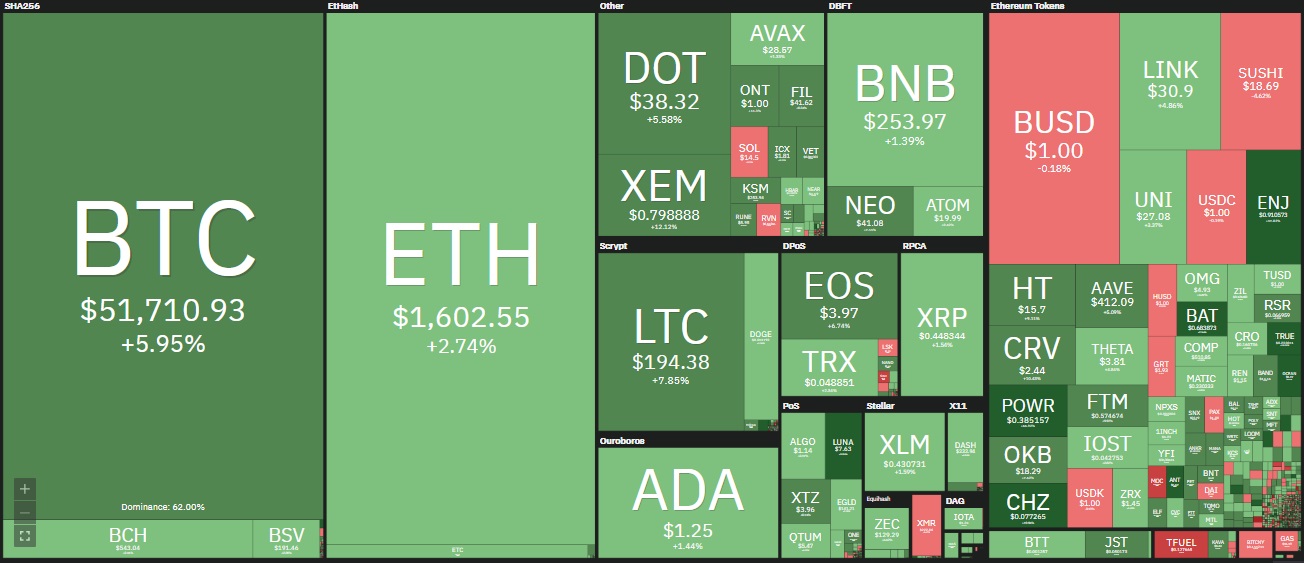
Following a sharp drop that pushed the price of Bitcoin to $ 47,000, the currency traded back at $ 50,000. The Altcoins market is also mostly green today.
Bitcoin crossed the $ 50,000 resistance
After a sharp drop last week that brought Bitcoin below $ 43,000, the currency is slowly showing positive reactions as a new path opens up for the cows.
As reported yesterday, Bitcoin even broke the $ 50,000 level for a short time but could not maintain its momentum. The rejection of the price caused the currency to fall again and fall to the level of $ 47,000 (in Bitstamp).
Since then, Bitcoin has returned to this level once again, rising by about $ 3,000 to about $ 50,000. At the time of writing, Bitcoin is trading at $ 51477.
Technical indicators of the currency show that this particular price level is the first major resistance line in the uptrend of Bitcoin, so that BTC can cross the resistance levels of $ 52,500 and $ 55,000 after crossing this level.
If the price is rejected again, the support levels of $ 47,200, $ 46,600 and $ 44,750 can help.
Atrium reached $ 1,600
Most altcoins also saw unfavorable price movements last week, but were revisited in the last few days. Atrium, which has fallen to $ 1,300, has jumped nearly $ 300 since then and is now close to $ 1,600.
Cardano's 2% increase helped ADA remain third in the market value of digital assets. BinanceQueen (1%) and Ripple (2.5%) are also green in 24-hour timeframes. China Link has increased its value by 6% since yesterday and is currently priced above $ 30. The Polkadat also jumped 6.5 percent to trade at $ 38.
Nevertheless, Light Coin showed the most significant growth among the top ten currencies with a 12% increase. As a result, LTC is approaching the $ 200 mark.
Among the low and medium market value altcoins, the Energy Web Token had the best performance with 32% growth and reaching the $ 18 level. Ocean Protocol (22%), NEM (19%), Basic Attention Token (19%), Enjin Coin (18%), Phantom (13%), Decentraland (12%) and Ontology (11%) are next. they take.
Finally, the total cryptocurrency market capitalization remains above $ 1.5 trillion.
Technical analysis of the global gold ounce Tuesday, March 2

The price of an ounce of global gold on Tuesday continued its downward trend for the fourth consecutive day after the increase in demand and the growth of the US dollar index.
The price of gold is currently affected by the trend of the dollar index and the rate of return of treasury bonds in the absence of important economic news.
Due to the four-hour time frame, the price of gold is breaking the downside channel. If a four-hour candle closes below the support level of the trend line at $ 1,712, we can expect the price to fall to the bottom of 2020, ie $ 1,671.
If this support level is not broken, the price will rise to the level of the moving average indicator 21 in the four-hour time frame, ie $ 1,755.