صفحه اصلی تقویم اقتصادی تحلیل رمزارزها (Cryptocurrency) تحلیل طلا (Gold) تحلیل فارکس (Forex) ارتباط با من درباره من
سایت تحلیل بورس، فارکس و ارز دیجیتال حمید راحت حق| Rahathagh.ir

اخبار و تحلیل نموداری و تکنیکالی بازارهای مالی دنیا اعم از بازار بورس داخلی، بازار فارکس، بازار طلا و بازار ارز دیجیتال و رمزارزها و روانشناسی بازار

Cardano Analysis (ADA) Wednesday, March 10

Cardano Analysis (ADA) Wednesday, March 10

https://s17.picofile.com/file/8427526692/cardano_%D8%B1%D8%A7%D8%AD%D8%AA_%D8%AD%D9%82.jpg
Matt Cardano Digital has taken a low-swing trend after crossing the border of the regular triangle pattern. According to this model, Cardano has a goal of $ 1.56.
According to the IOMAP chart, Cardano is on the rise in the absence of strong resistance. However, the $ 1.15 to $ 1.18 resistance range is particularly important. In this price range, over 2.1 billion Cardanos have been purchased by 38,250 user accounts.
Prices are currently above the level of a significant self-stabilization support. According to the IOMAP chart, about 147,000 accounts have purchased 5.1 billion of these digital currencies in the $ 1.11 to $ 1.15 range.

Looking at the four-hour timeframe, we notice the formation of a regular triangle pattern and its breaking. According to this pattern, the price is likely to grow by 34% to $ 1.56. Despite the breaking of this pattern, the uptrend of stability is still not formed. On the other hand, stabilizing the high price of moving average indicators is necessary to form an uptrend.
Similarly, if the MACD indicator is above the signal line, then the $ 1.56 target can be predicted with more confidence.
On the other hand, if the price penetrates below the levels of 50 and 100 moving average indicators in the four-hour time frame, a downward trend is formed and if the price returns to the triangle pattern range, one can expect a further fall in price.

۲۰ اسفند ۹۹ ، ۱۲:۵۲
حمید راحت حق

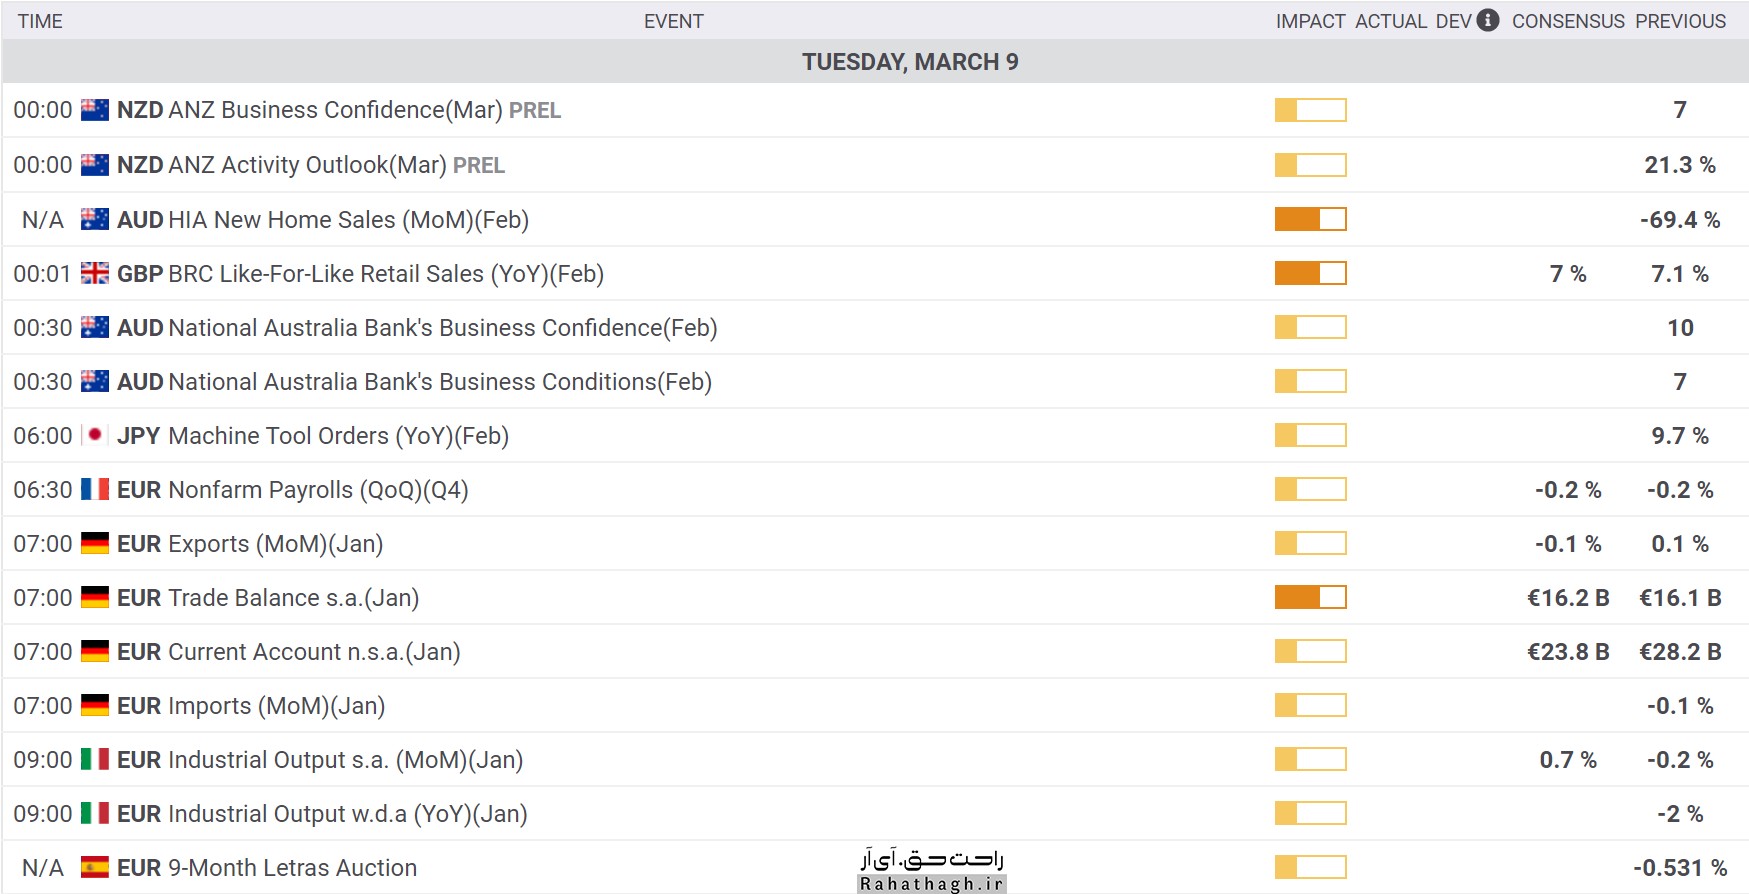
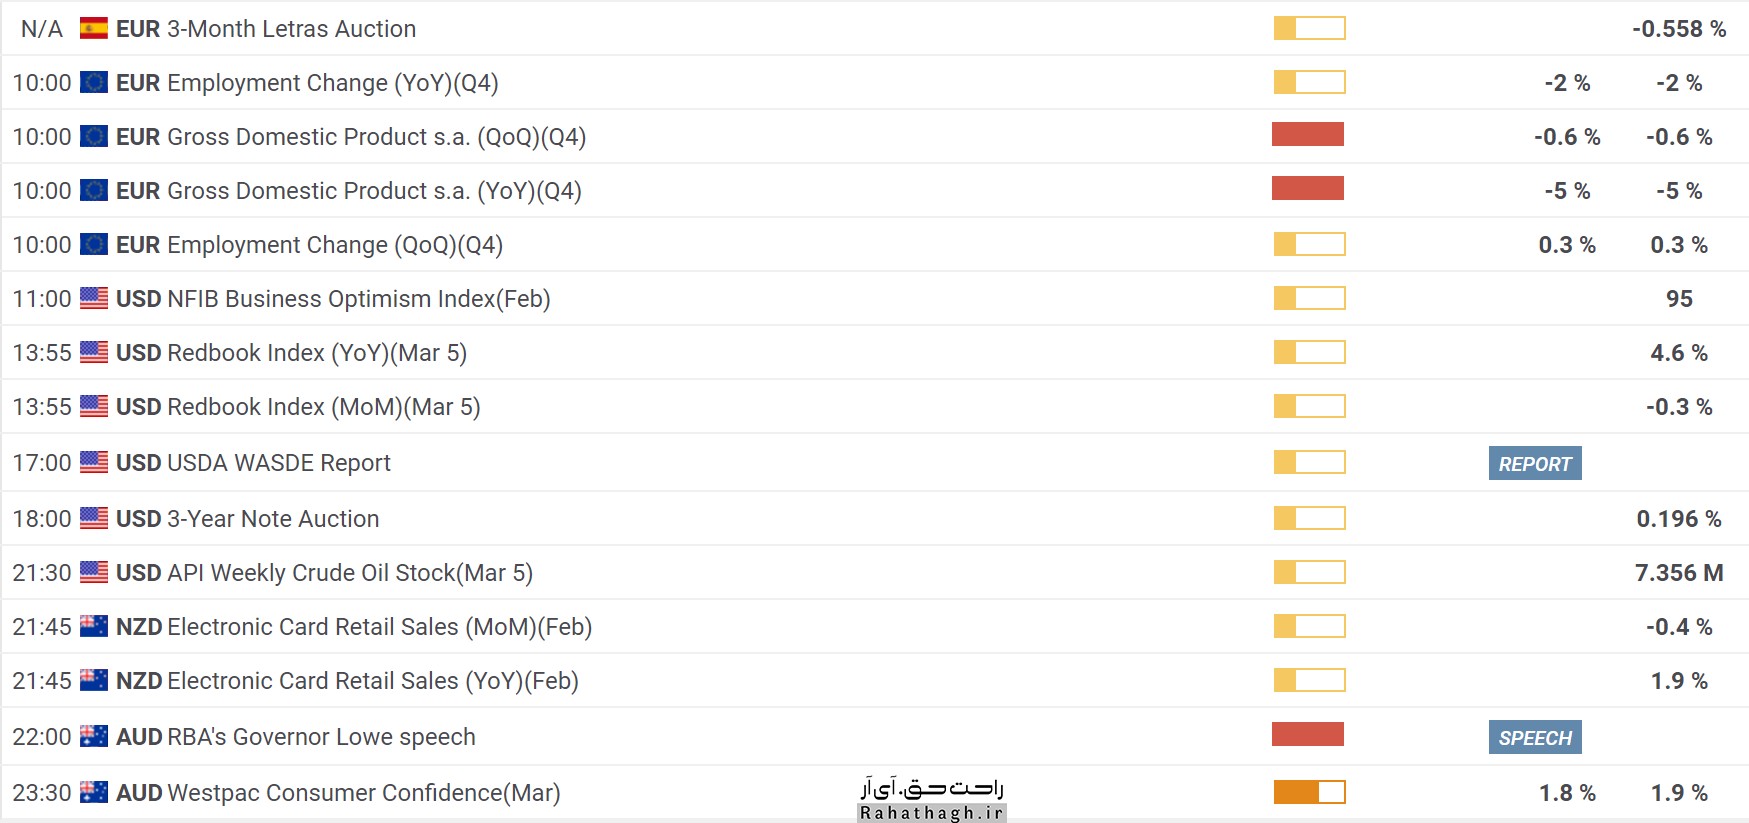
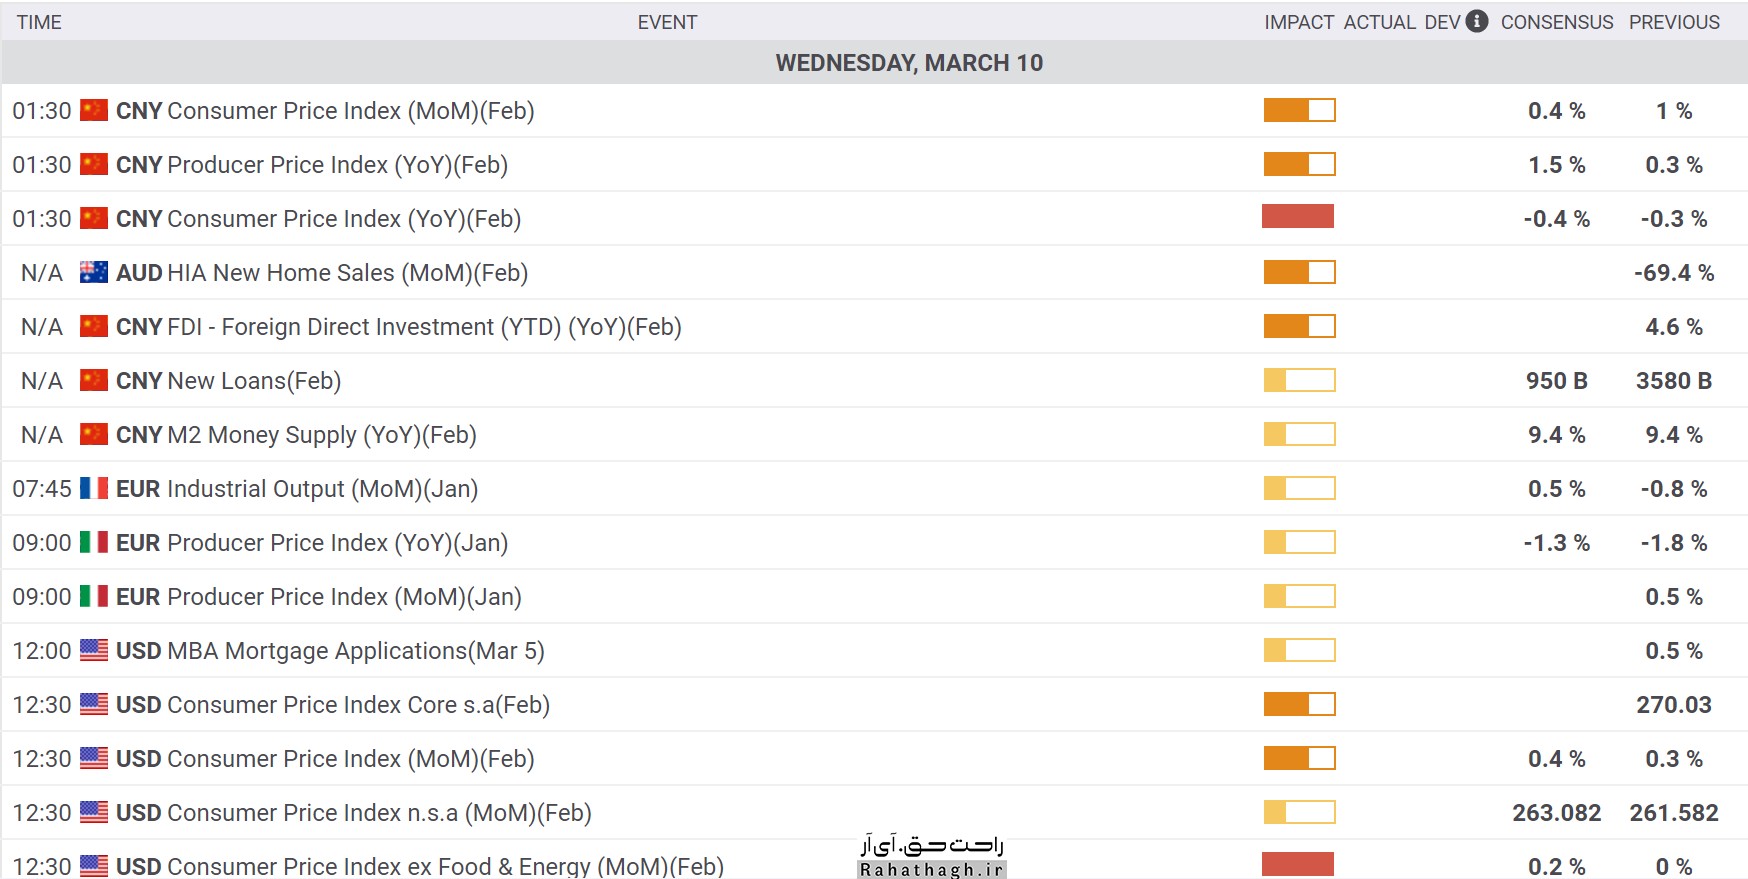
Economic calendar Wednesday, March 10

Economic calendar  Wednesday, March 10

https://s17.picofile.com/file/8427463076/eco10_3_%D8%B1%D8%A7%D8%AD%D8%AA_%D8%AD%D9%821.jpg https://s16.picofile.com/file/8427463100/eco10_3_%D8%B1%D8%A7%D8%AD%D8%AA_%D8%AD%D9%822.jpg

۲۰ اسفند ۹۹ ، ۰۹:۰۰
حمید راحت حق

Weekly evaluation of Kitco site from the expectations of gold market investors Tuesday, March 9

Weekly evaluation of Kitco site from the expectations of gold market investors  Tuesday, March 9

https://s16.picofile.com/file/8427427168/kitko9_3_%D8%B1%D8%A7%D8%AD%D8%AA_%D8%AD%D9%82.jpg
The strengthening dollar, the jump in Treasury yields and investor optimism about strong US economic growth have pushed down the price of an ounce of global gold. Kitco News 'weekly assessment also shows market participants' pessimism about the future of the gold market. Now the question that has occupied the minds of most market participants is how much will the rate of return on treasury bonds increase?
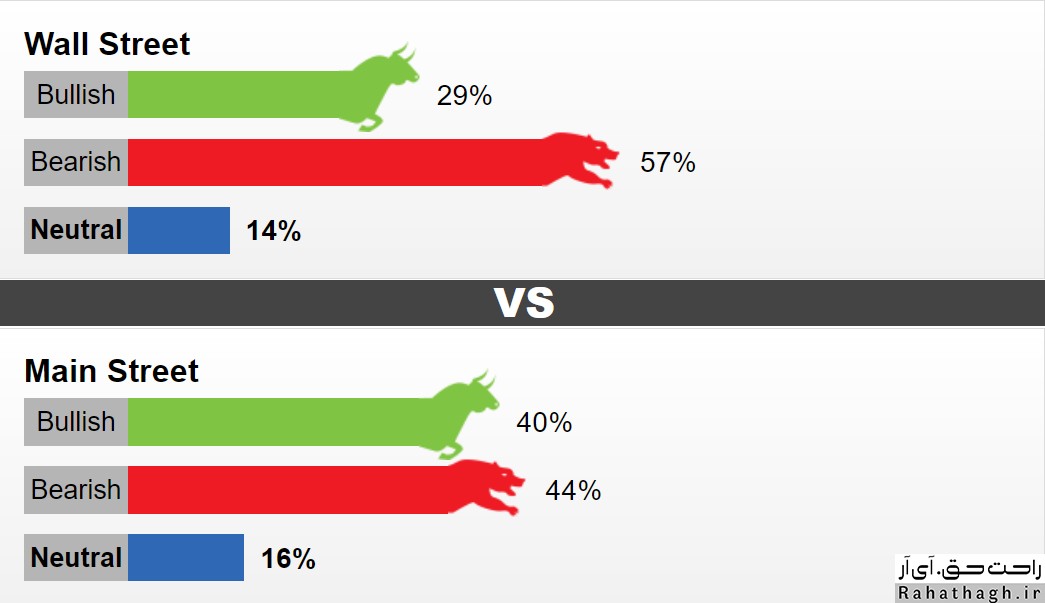
This week, 13 Wall Street activists took part in the weekly evaluation of the Kitco site. 29% predict that this week's trend will be an upward ounce of global gold. 57% predict that the market trend will be downtrend and another 14% expect the market to be trending or neutral. Meanwhile, 1,482 Main Street investors took part in the online survey. 40% are in favor of an uptrend, 44% are in favor of a downtrend and 16% are in favor of a trend-free market.
On Friday, the price of an ounce of global gold reached the support of $ 1680. The strong growth of 379 thousand NFP units was the main reason for the fall in the price of an ounce of global gold. US employment growth was much higher than market forecasts. Despite the fact that the price of an ounce of world gold rose from the price floor on Friday, XAUUSD ended the week in the negative range. As US economic performance improves, some analysts believe that Treasury yields could rise further. Especially since the US Federal Reserve has no problem raising the rate of return on Treasury bonds. The head of the Federal Reserve has said that raising interest rates alone is not enough to raise interest rates and exit expansionary monetary policy. It does not seem to matter to the US Federal Reserve what the rate of return on Treasury bonds is.
The views of gold market professionals

Phillip Streible is the senior market strategist at Blue Line Futures
"Whenever the rate of return on treasury bonds peaks, there will be a price floor in ounces of global gold."
Darin Newsome President of Darin Newsom Analysis
"The views of the head of the US Federal Reserve mean that the rate of return on Treasury bonds could rise further without the central bank intervening. "Increasing the rate of return on treasury bonds will put pressure on the price of an ounce of global gold."
Ole Hansen leads the commodity strategy team at Saxo Bank
The market activist expects the global ounce price to rise in the medium term. According to him, the price of an ounce of global gold has been able to maintain its support in the 11-month price floor. However, in the opinion of this professional activist, the challenges facing gold buyers are not over yet. "The price of an ounce of global gold will not rise until the yield on Treasury bonds and the US dollar reaches equilibrium. The Federal Reserve also has no plans to deal with rising Treasury yields. In other words, for the Federal Reserve to get involved, the country's financial system will face a significant increase in borrowing costs and will suffer a lot. "
Adrian Day, President of Adrian D. Capital Management Company
Adrian Day still hopes for an ounce of global gold, as long as fundamental issues support the price of an ounce of global gold. He believes that the strong growth of the dollar and the rate of return on treasury bonds will hurt the price of an ounce of global gold. "As long as the dollar trend and the rate of return on treasury bonds are bullish, the situation will be difficult for gold buyers. "At the moment I am just watching the situation and I will enter the market at reasonable prices."
Colin Cieszynski SIA Wealth Management Senior Market Strategy
The global gold ounce price will also be under pressure until inflation rises to significant levels, the activist said. He believes that other than gold, commodities are rising in price, which means that inflationary pressures will soon intensify.

۱۹ اسفند ۹۹ ، ۱۲:۲۷
حمید راحت حق

Fundamental analysis of the euro Tuesday, March 9

Fundamental analysis of the euro Tuesday, March 9

https://s17.picofile.com/file/8427426226/euro_%D8%B1%D8%A7%D8%AD%D8%AA_%D8%AD%D9%82.jpg

Last week, almost all European Central Bank officials warned that the ECB should respond to rising bond yields. The growth of European bond yields is due to investors' fear of inflationary pressures that will emerge after the recovery of the global economy. From a fundamental analysis point of view, it is very unlikely that the European Central Bank will reduce interest rates or tighten expansionary monetary policy at this week's interest rate meeting. But the recent jump in European bond yields (especially the 10-year German government bond yields) could force the European Central Bank to make a small change in monetary policy and perhaps increase bond purchases to prevent further growth in bond yields. Give. The slope of the German government bond yield curve has recently widened, worrying European monetary policymakers.
A member of the board of the European Central Bank (Fabio Panetta) said last week that the sharp rise in the yield curve is an unfortunate event that the European Central Bank should stop growing as soon as possible by increasing the volume of bond purchases. The head of the French central bank also said that the rise in bond yields is unjustifiable and the European Central Bank (ECB) must deal with it. Most members of the European Central Bank seem to agree with the increase in the volume of bond purchases under the PEPP program.
Undoubtedly, the increase in the volume of bond purchases by the European Central Bank will be to the detriment of the EURUSD currency pair. Data on the volume of European Central Bank bond purchases will be released on Monday. On the other hand, if the volume of bond purchases does not change, the euro will strengthen. In that case, the euro trend will depend on the words of the head of the European Central Bank.

۱۹ اسفند ۹۹ ، ۱۲:۲۰
حمید راحت حق

The initial reaction of the dollar and the US stock market to the approval of the financial package

The initial reaction of the dollar, the Treasury and the US stock market to the approval of the financial package

https://s16.picofile.com/file/8427425042/dollar_%D8%B1%D8%A7%D8%AD%D8%AA_%D8%AD%D9%82.jpg

Investors are keen to buy and hold US dollars. In global markets and this month, the US dollar index has climbed to its highest level in four months. The US Senate has approved Biden's $ 1.9 trillion bailout package, and the House of Representatives is expected to approve it today and sign it by the end of the week.
Under a previous US government support program, $ 600 in subsidies were able to support US retail and consumer spending. This time, a $ 1,400 support payment is planned and is expected to support the US economy more than ever. According to the US government, approximately 98% of those who received the $ 600 payment will also receive the $ 1,400 government payment. In the meantime, the benefits for the unemployed have been extended. US government support, along with widespread vaccination in the United States, will support the US economic recovery.
Yesterday, the US stock market showed a vague performance in response to the approval of the government financial package. While the Dow Jones industrial average rose, the S&P 500 and NASDAQ stock indexes fell. It seems that in the current situation, investors are not interested in buying shares of technology companies. The US dollar has also reacted positively. US 10-year Treasury yields also rose above 1.60 percent. From a fundamental analysis point of view, the US dollar is expected to continue to grow and the main focus of the market will be on US inflation indicators. US inflation data will be released on Wednesday. Given that energy prices rose sharply in February, US inflation data is expected to be stronger than market forecasts.

۱۹ اسفند ۹۹ ، ۱۲:۰۹
حمید راحت حق

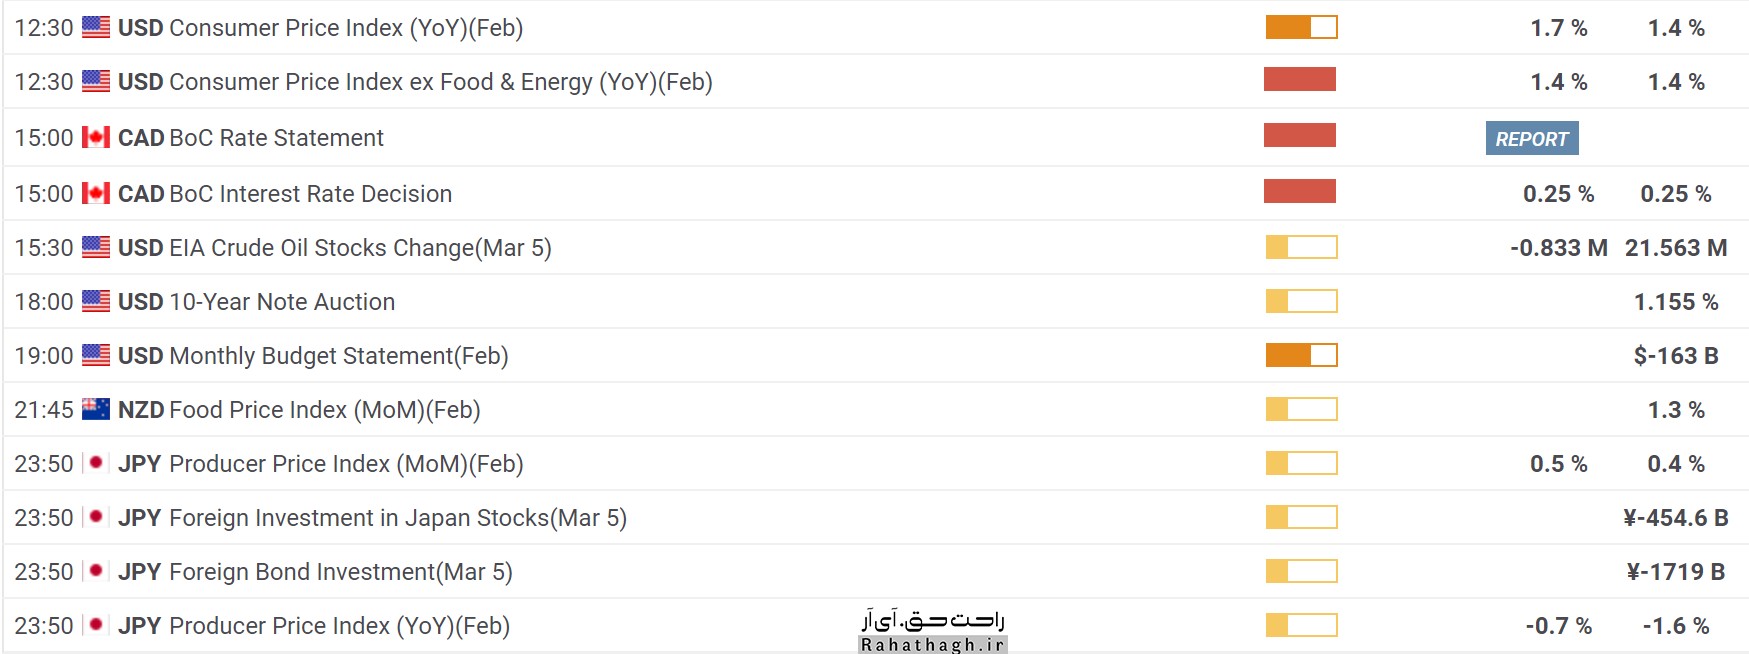
Economic calendar Tuesday, March 9

Economic calendar  Tuesday, March 9

https://s17.picofile.com/file/8427333500/eco9_3_1_%D8%B1%D8%A7%D8%AD%D8%AA_%D8%AD%D9%82.jpg https://s17.picofile.com/file/8427333526/eco9_3_2_%D8%B1%D8%A7%D8%AD%D8%AA_%D8%AD%D9%82.jpg

۱۹ اسفند ۹۹ ، ۰۹:۰۰
حمید راحت حق

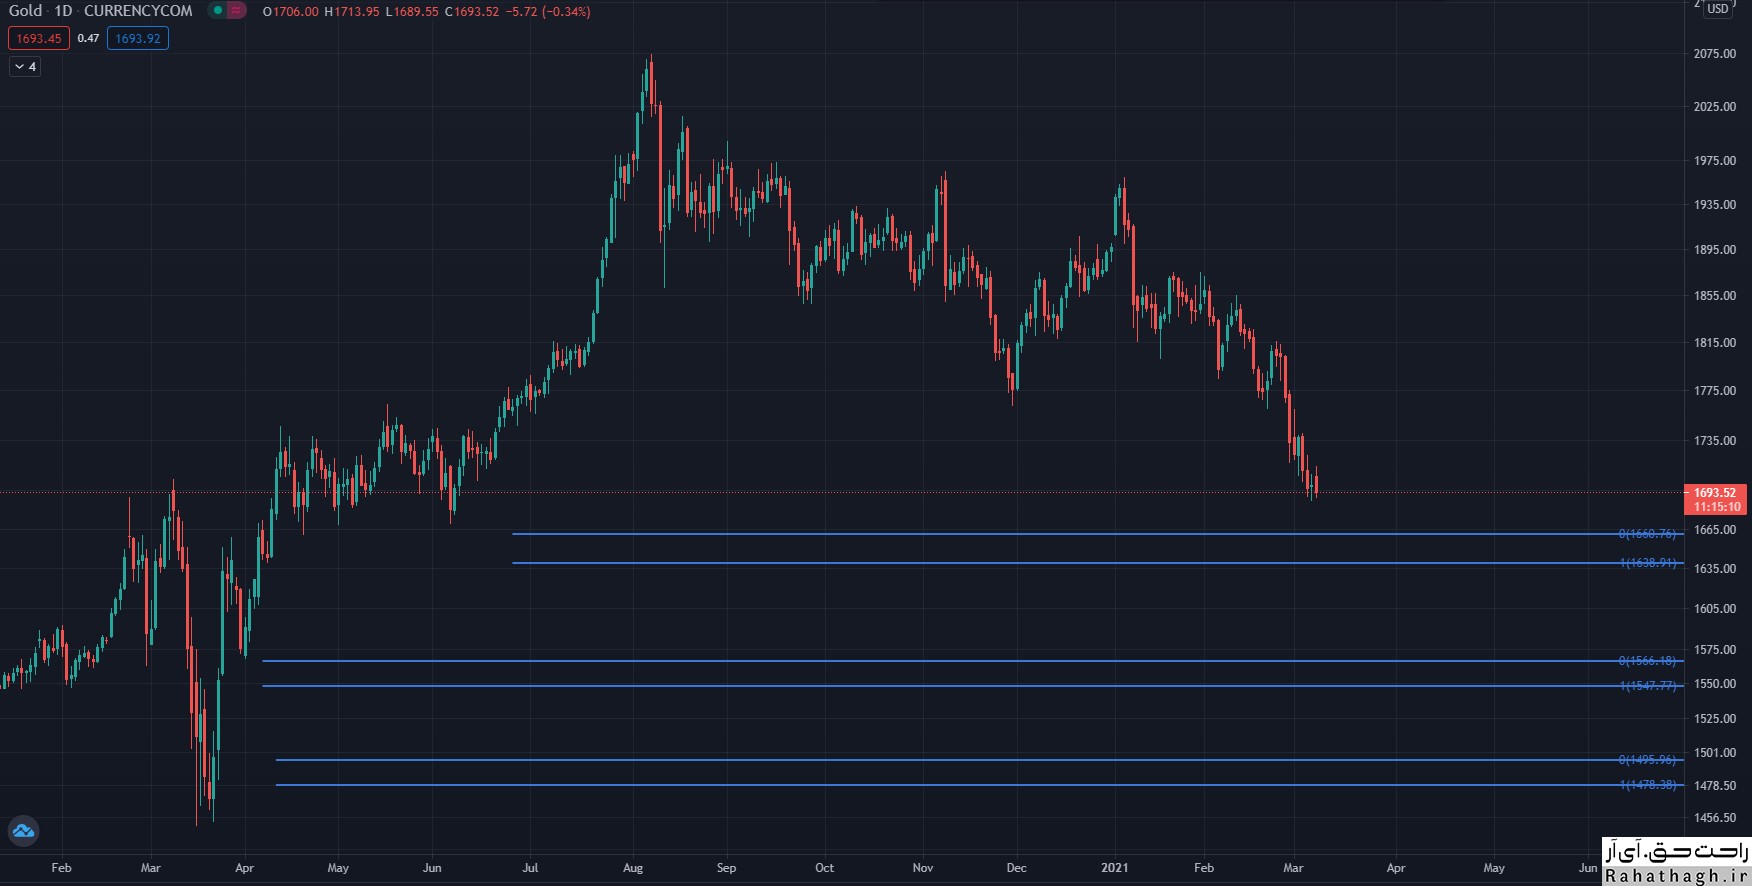
Check the gold trend Monday, March 8

Check the gold trend Monday, March 8

https://s16.picofile.com/file/8427330700/gold8_3_%D8%B1%D8%A7%D8%AD%D8%AA_%D8%AD%D9%82.jpg
The global ounce price rose 0.57% to $ 1,708 as Monday's trading session in Europe approached. Thus, the price of gold has started to rise from its 9-month low.
Given the RSI indicator reached the sell-off zone and the formation of a Dodge candlestick pattern on Friday, there is a possibility that this corrective trend will continue.
However, the bearish trend line since November 30 at $ 1,760 is a resistance.
Meanwhile, the $ 1,700 level plays the role of the first important support that if the price penetrates below this level, we can expect a fall to the downtrend line formed on August 12 at $ 1,677.
If the $ 1,677 support is broken, the price of gold will fall to the level of $ 1,670 and eventually to $ 1,610.

Technical levels
Last price of the day: $ 1707.8
Daily fluctuations: 9.6
Daytime fluctuations (٪): 0.57
Starting price: $ 1698.2
Trends
20-day moving average: $ 1779.02
50-day moving average: $ 1829.15
100-day moving average: $ 1848.59
200-day moving average: $ 1860.11
Levels
Yesterday's highest price: $ 1707.26
Yesterday's lowest price: $ 1687.37
Last week's highest price: $ 1759.98
Last week's lowest price: $ 1687.37
Last month's highest price: $ 1871.9
Last month's lowest price: $ 1717.24
Fibonacci 38.2. Daily: $ 1699.97
Fibonacci 61.8. Daily: $ 1695.16
Pivot S1 Daily: $ 1687.89
Pivot S2 Daily: $ 1677.39
Pivot S3 Daily: $ 1667.4
Pivot R1 Daily: $ 1708.18
Pivot R2 Daily: $ 1718.17
Pivot R3 Daily: $ 1728.57

۱۸ اسفند ۹۹ ، ۱۴:۲۵
حمید راحت حق

Check the GBPUSD trend

Check the GBPUSD trend

https://s17.picofile.com/file/8427322368/gbpusd8_3_%D8%B1%D8%A7%D8%AD%D8%AA_%D8%AD%D9%82.jpg
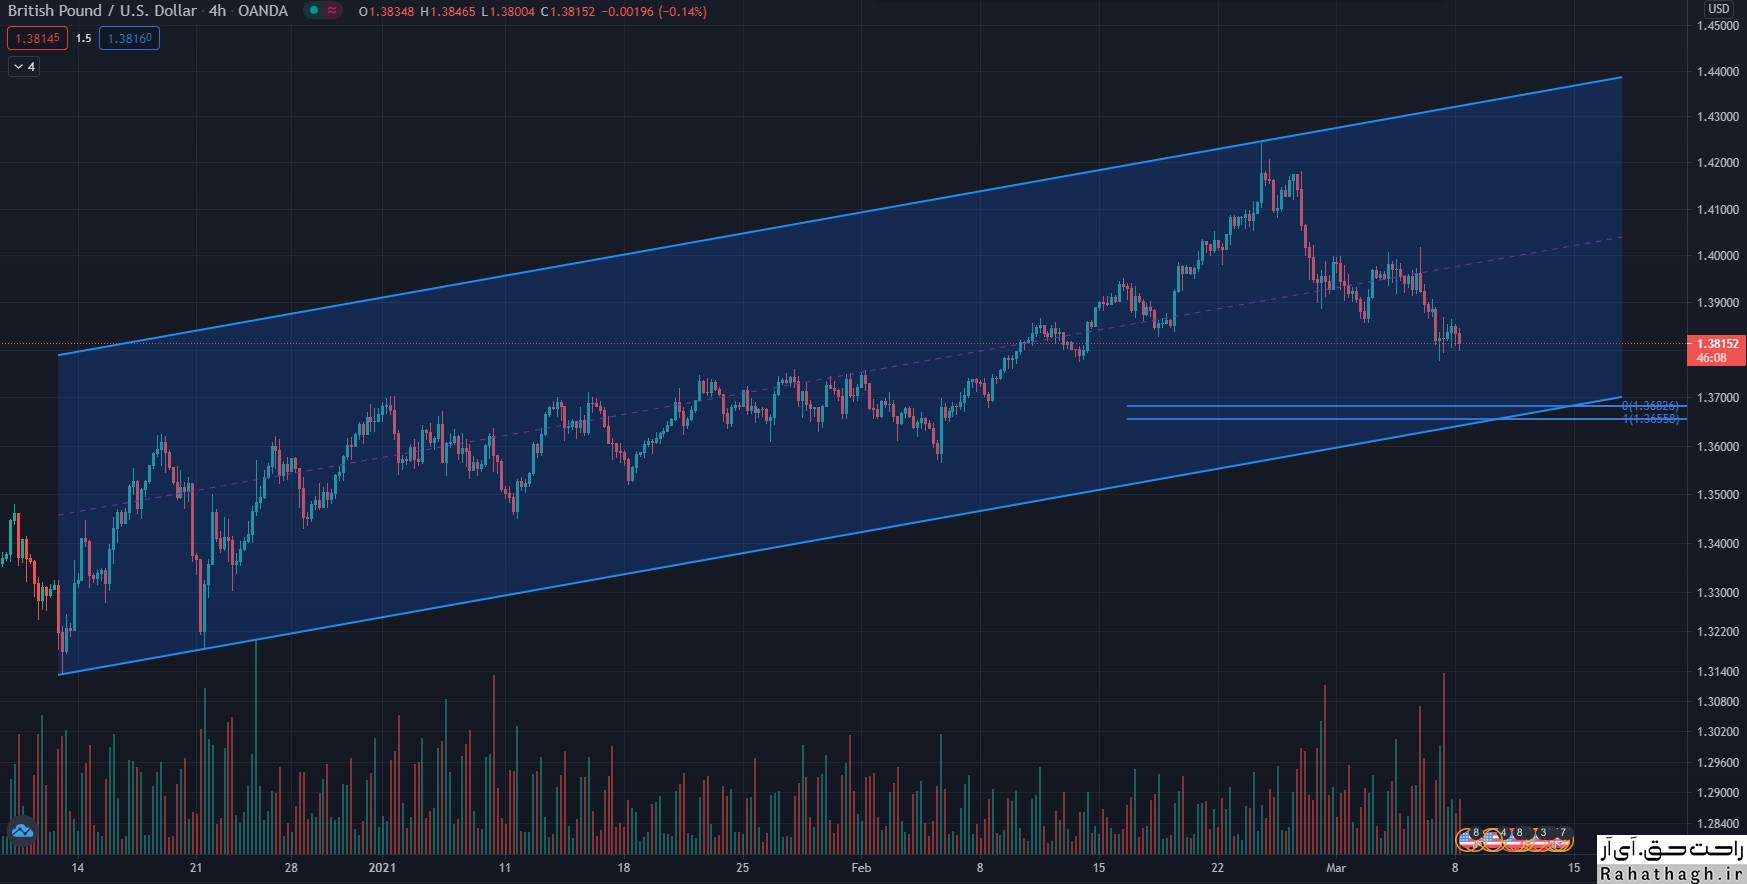
The short-term trend of the British pound against the US dollar is down, and the correction can continue until the 38.2% Fibonacci correction at the rate of $ 1,3642. These levels are expected to turn supportive and the GBPUSD currency pair to return upwards. From the buyers' point of view, if the GBPUSD crosses the above resistance level of $ 1,44016, the pair will be ready to hit $ 1,440 again.

۱۸ اسفند ۹۹ ، ۱۲:۴۷
حمید راحت حق

Check the EURUSD trend

Check the EURUSD trend

https://s17.picofile.com/file/8427321142/eurusd_%D8%B1%D8%A7%D8%AD%D8%AA_%D8%AD%D9%82.jpg
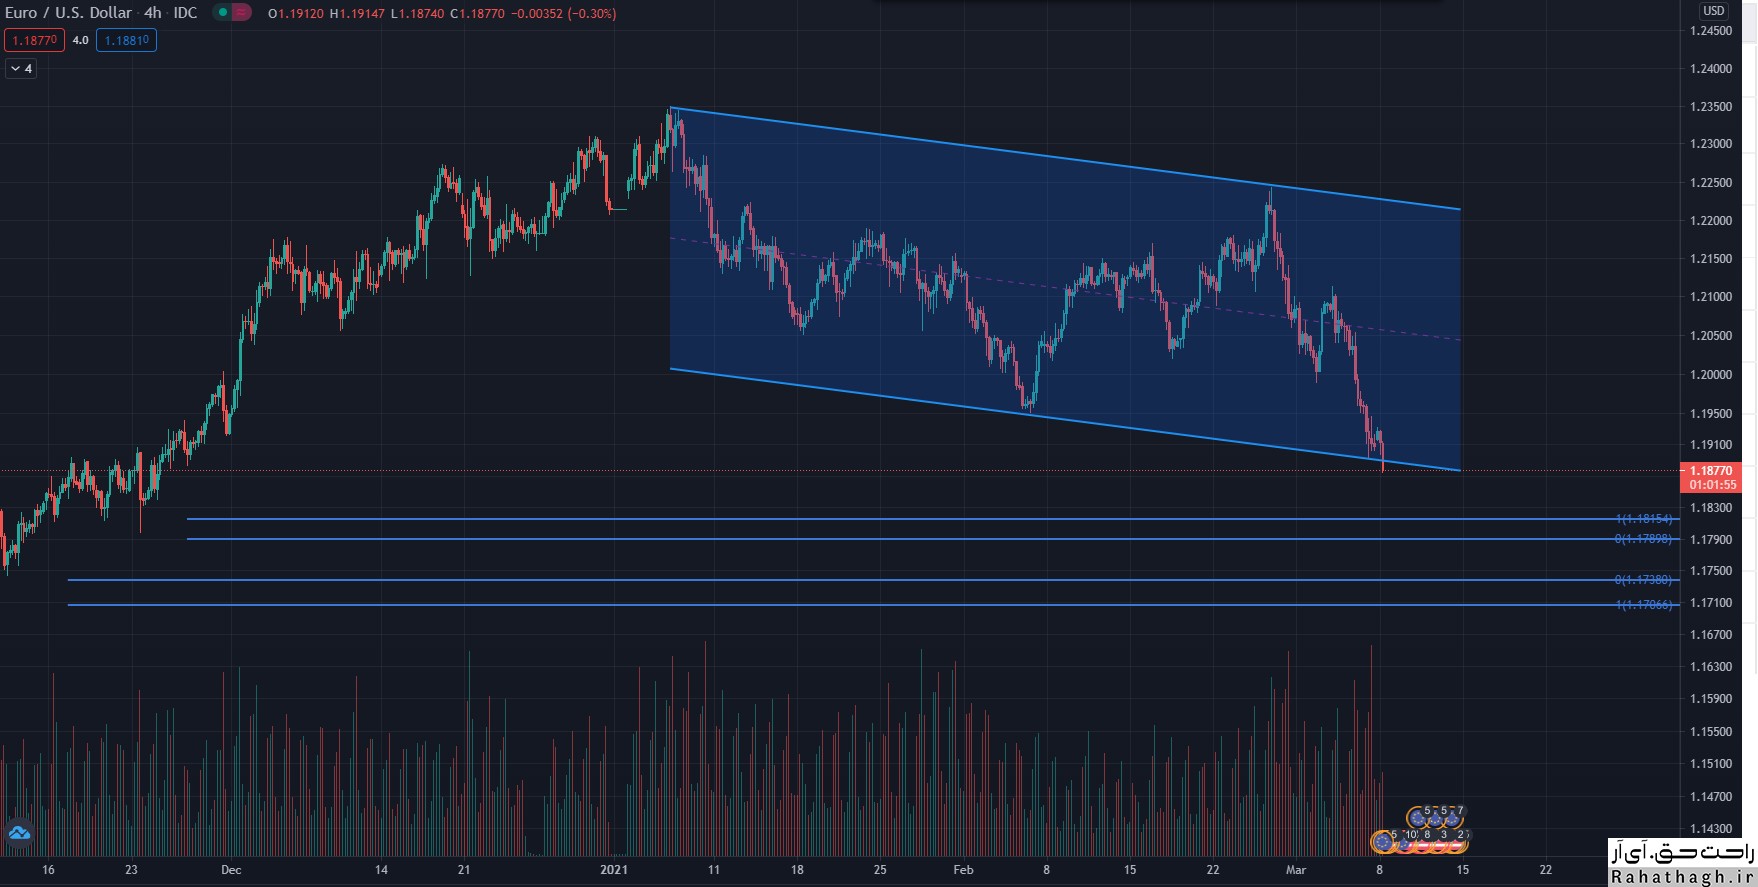
The short-term trend of the euro against the US dollar is declining. An uptrend starting at $ 1,2348 could push the EURUSD pair to the 100% Fibonacci level at $ 1,1845. EURUSD is expected to form a price floor around these levels. From the buyers' point of view, if the EURUSD crosses above the $ 1.90 resistance level, the short-term market trend will be neutralized. A break of resistance at $ 1,212 will confirm the formation of a short-term price floor. However, if the EURUSD falls below $ 1.1845, the downtrend will pave the way for the Fibonacci 38.2% correction at $ 1.1694.

۱۸ اسفند ۹۹ ، ۱۲:۳۵
حمید راحت حق

5cryptocurrencl currencies to watch this week - Monday, March 8

5 cryptocurrency currencies to watch this week

https://bayanbox.ir/view/1535694930976495508/crypto-%D8%B1%D8%A7%D8%AD%D8%AA-%D8%AD%D9%82.jpg  
Bitcoin Fund Indicators (BTC) strengthened after the US Senate passed a $ 1.9 trillion support package bill on March 7. If traders' reaction to the bill is similar to that of April 2020, then cryptocurrencies could see another powerful rally.

This stimulus package increases the focus on the devaluation of the US dollar. According to Peter Brent, these concerns could lead some investors to turn their assets into hard or bitcoin assets instead of keeping them in Fiat currencies.

In addition to investors, a growing number of large companies are deciding to protect their Fiat reserves by buying bitcoins. Following the acquisition of significant amounts of bitcoin by reputable companies such as Microstrategy, Tesla and Square, a Chinese company called Meitu has now announced that it has added $ 40 million in bitcoin and ether to its assets.

If other companies around the world follow these steps and invest part of their treasury reserves in Bitcoin, there will be a kind of imbalance between supply and demand, and as a result, prices will skyrocket.

In the continuation of this discussion, we will examine the charts of the top 5 cryptocurrencies of the week that may resume their upward trend in the short term.

BTC / USD

On March 5 and 6, Bitcoin fell below the 20-day moving average (at $ 48,484), but the long tail on each candlestick indicates that buyers are ready to buy at lower levels. The bulls (buyers) are currently pushing the price towards the upward resistance of $ 52040.

While the 20-day moving average is flat, the Relative Strength Index (RSI) has begun to rise to a high of 58, indicating cows trying to return.

If buyers can push the price above this resistance, the BTC / USD pair may once again touch the $ 58341 record. Breaking this level could start the next stage of the uptrend, which may continue up to $ 71,212.

Contrary to this assumption, if the price falls from this upward resistance and falls below the level of $ 46,313, the price of this pair may fall to the average of the 20-day moving average at the level of $ 42861. This level is likely to act as a strong support.

If the pair returns from this support level, they may spend a few more days in the consolidation phase. But if the bears push the price below $ 41,959.63, traders may be in a hurry to exit, which could lead to a possible change in the bitcoin movement.

In the pair's 4-hour chart, a reverse head and shoulder pattern is formed, which is completed by the breakout and closing of the price at the level of $ 52040. This uptrend has a $ 61075 target.

20-EMA has started to rise and the RSI has reached above the level of 62, which indicates a slight advantage for the cows.

If the price falls below current levels or the resistance overhead breaks the $ 47,000 minister, this uptrend will lose its credibility. Such a move could pave the way for further support at $ 41959.

UNI / USD

After a three-day consolidation period near the $ 29 level, UNI broke the upward resistance yesterday. If the cows can keep the price above $ 29, the outlook for the resumption of the uptrend is strengthened.

Both moving averages have an uptrend, and the RSI is in the buying saturation zone, indicating that the cows are in control. If the UNI / USD pair rises above $ 33, the next price level to look out for is $ 38 and then $ 46.

If the price falls below the current level and falls below the 20-day moving average ($ 25.31), this uptrend will be invalidated. In such a situation, the pair may fall to the level of $ 22 and then the simple 50-day moving average ($ 19.78).

The pair's 4-hour chart shows that the bears are likely to strongly defend the $ 32 upstream resistance. However, if the cows do not allow the price to fall below 20-EMA, it will indicate their strength. A break above the $ 32- $ 33 price range could kick off the next phase of the uptrend.

If the price falls below the 20-EMA, this uptrend will be invalidated. Such a move would indicate that traders are taking action to raise profits when prices rise. After that, the pair could fall to 50-SMA.

THETA / USD

The THETA cryptocurrency is currently in a strong uptrend. Although the price of this Altcoin fell on March 7 (March 17), but the long tail on the candle on March 8 (March 18) shows the purchase at low price levels. Corrections in a strong uptrend usually take one to three days, after which the main trend resumes.


Moving bullish averages and the RSI being close to the buy saturation zone indicate that the cows are in control of the market. If buyers are able to push the price above $ 4.72, the THETA / USD pair may resume its uptrend to $ 5.73.

Conversely, if the price falls from $ 4.50 to $ 4.72 above the resistance area, it is likely to fall to the 20-day moving average ($ 3.58). The return of the price from this support level shows that because the cows continue to buy this currency when the price falls, the positive sentiments of the market remain strong.

If the bear pulls the price below the 20-day moving average, a deeper correction to the 50-day moving average ($ 2.82) is possible. Such a move indicates a momentary weakening of the currency and may delay the resumption of the uptrend.

The 4-hour chart of the THETA / USD pair shows that the 20-EMA is rising and the RSI is in the positive zone. If the bulls can push the price above the downtrend and keep it at the same level, the pair may touch the $ 4.72 level again. The defeat of this resistance can start the next stage of the uptrend.

On the other hand, if the price continues to correct, it will probably find good support in 20-EMA. In this situation, the cows are again trying to bring the price to levels above the downtrend line. However, a break below the 20-EMA could push the price down to $ 3.85.

VET / USD

Vicin is currently limited in the range of $ 0.0345 to $ 0.060774. The price had reached the resistance level during this period, but yesterday's long wick of the candle shows a profit reservation near the level of $ 0.060774.

However, the moving averages have an uptrend, and the RSI is in the positive zone, indicating that the path with the least resistance is an uptrend. If the bulls can move the price above the level of $ 0.060774 and maintain that level, the VET / USD pair can start the next stage of its uptrend.

The first target in this uptrend is $ 0.087048 and if it crosses this level, the pair may reach $ 0.10.

Contrary to this assumption, if the price falls below the current level, the VET / USD pair is likely to fall to the 20-day moving average ($ 0.047). The return of this support shows that the uptrend remains unchanged, but a break below this support may be followed by price movements in a limited range.

 Cows have not yet allowed prices to fall. If the pair returns from the 20-EMA, the cows will once again try to push the price above the resistance level.

If they can keep the price above $ 0.060774, the next stage of the uptrend may begin. However, if the price falls below the 20-EMA, the selling pressure is likely to intensify and the price will fall until further support at the 50-SMA.

LUNA / USD

Over the past few days, the Terra Token (LUNA) has been consolidating in the range of $ 5 to $ 8.50. Both moving averages have an uptrend, and the RSI is located near the buy saturation zone. This fact shows that the path with the least resistance is the ascending path.

On March 5, the cows were able to push the price above this level, but with this price failure, the upward movement did not continue and on March 6, the price of LUNA fell below $ 8.50. This indicates that demand has declined at higher levels.

However, if the cows do not leave the field, they indicate that traders are waiting to buy at lower price levels. In the event of such an event, buyers may try again to start the next phase of the uptrend. If successful, the LUNA / USD pair could approach the $ 12 level.

Long wicks on candlesticks above $ 8.50 indicate a higher profit margin. The cows are also currently trying to defend the 20-EMA. If the price returns from the current level, buyers will try again to resume the uptrend by pushing the price to higher levels of resistance above $ 8.50 to $ 9.

Conversely, if the bears can pull the price below 20-EMA and keep it there, the pair may reach 50-SMA. If the price returns from this level, the LUNA / USD pair is likely to consolidate in the upper half of this range for some time. The price drop below the simple moving average of 50 indicates the fact that the price may be in the range of $ 5 to $ 6.

۱۸ اسفند ۹۹ ، ۱۲:۱۲
حمید راحت حق