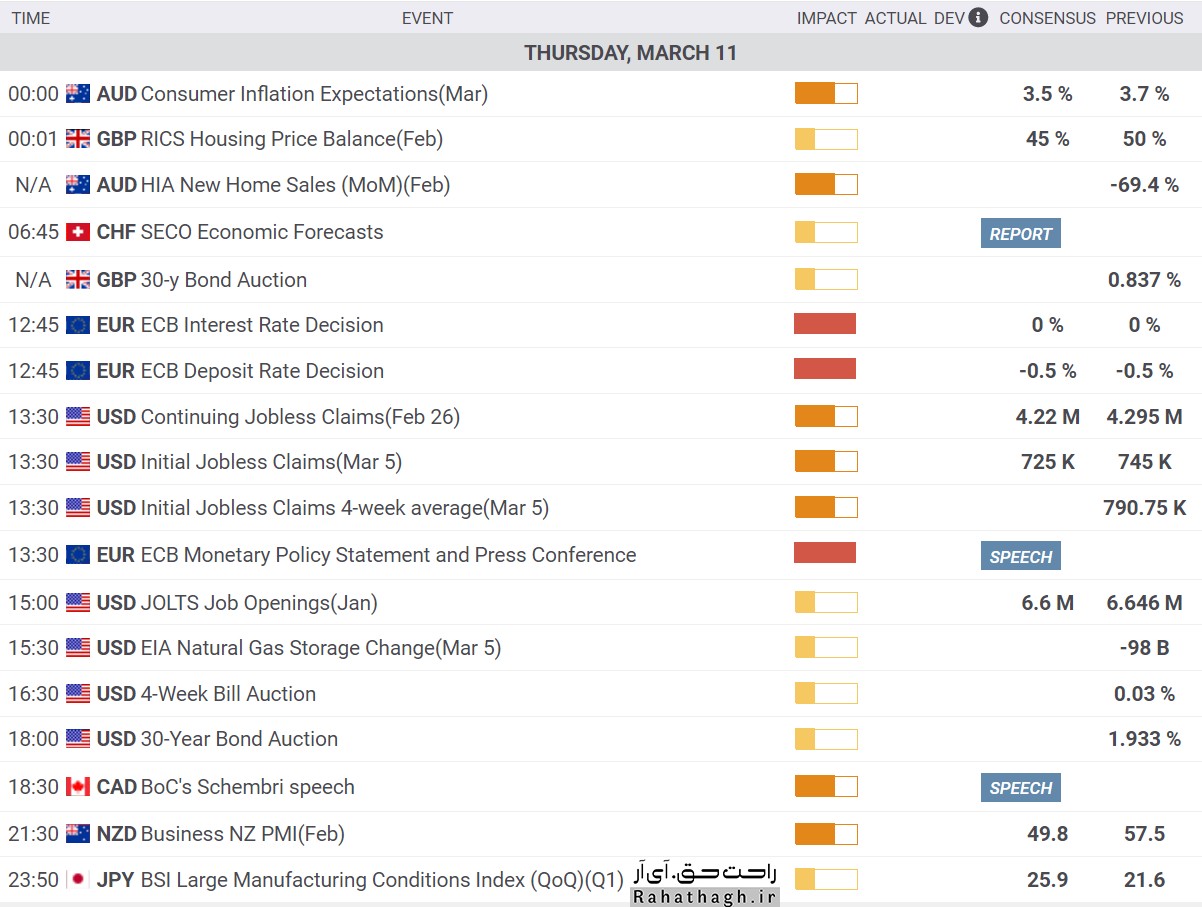
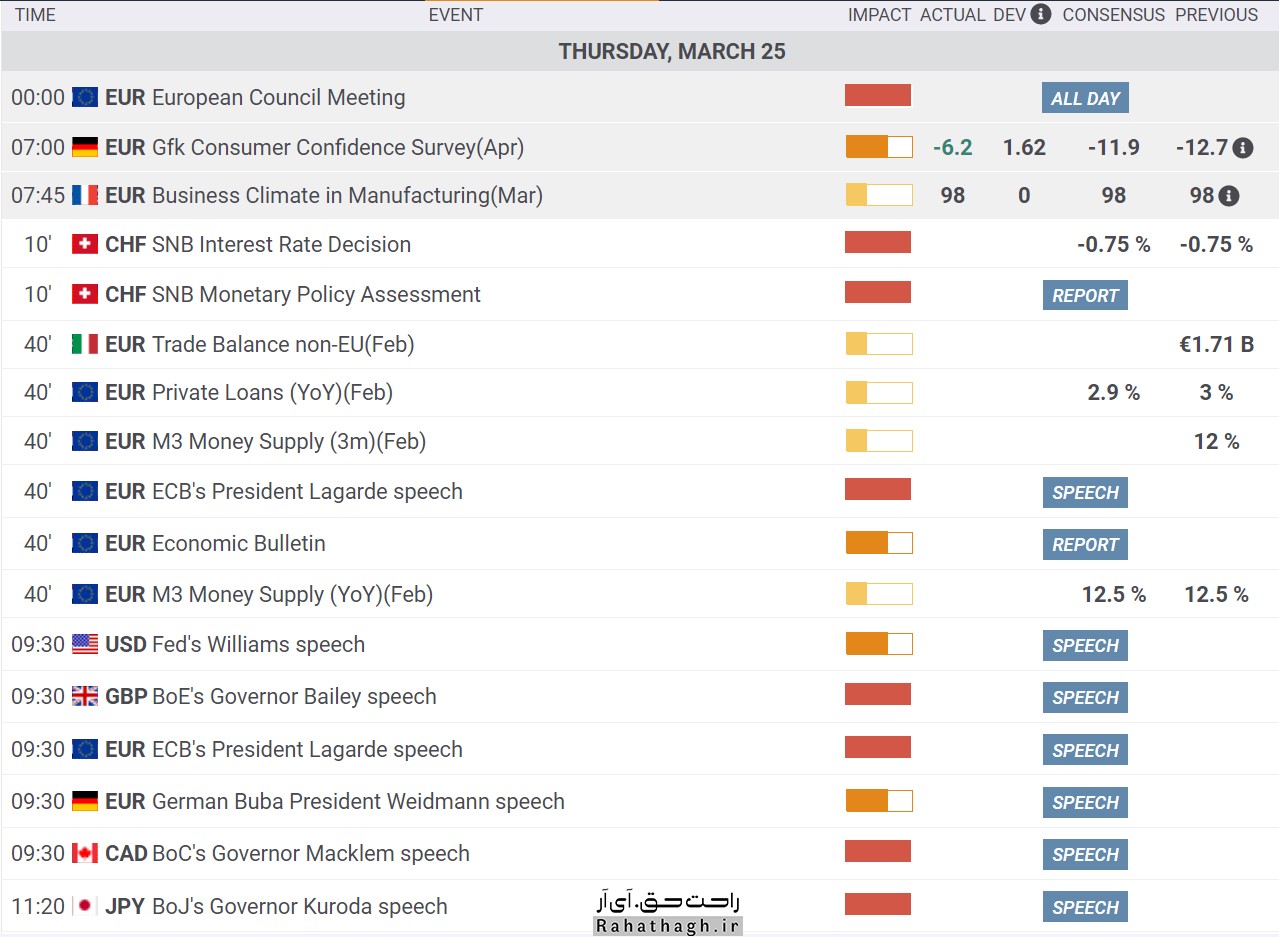
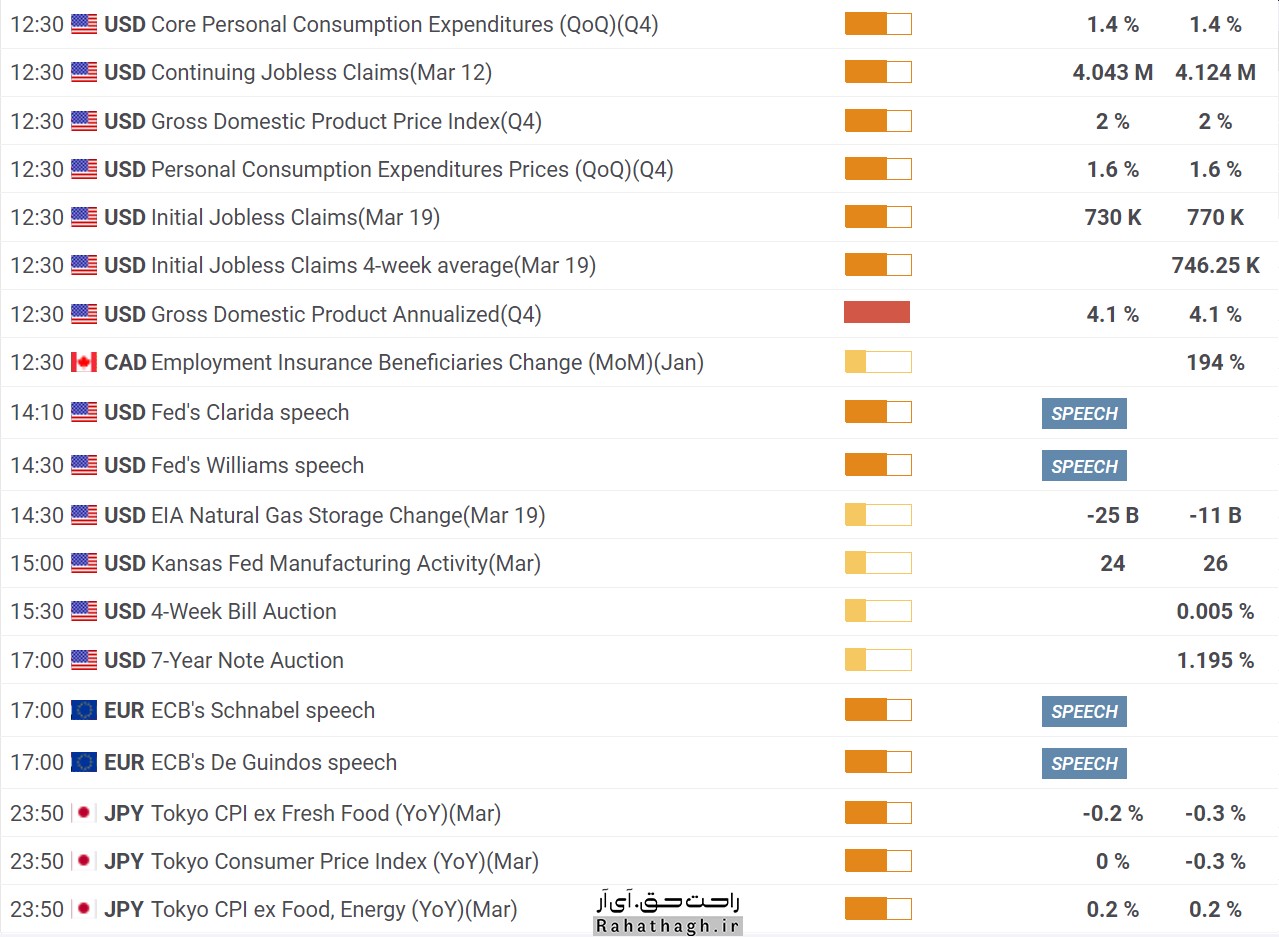
Economic calendar Thursday, March 25

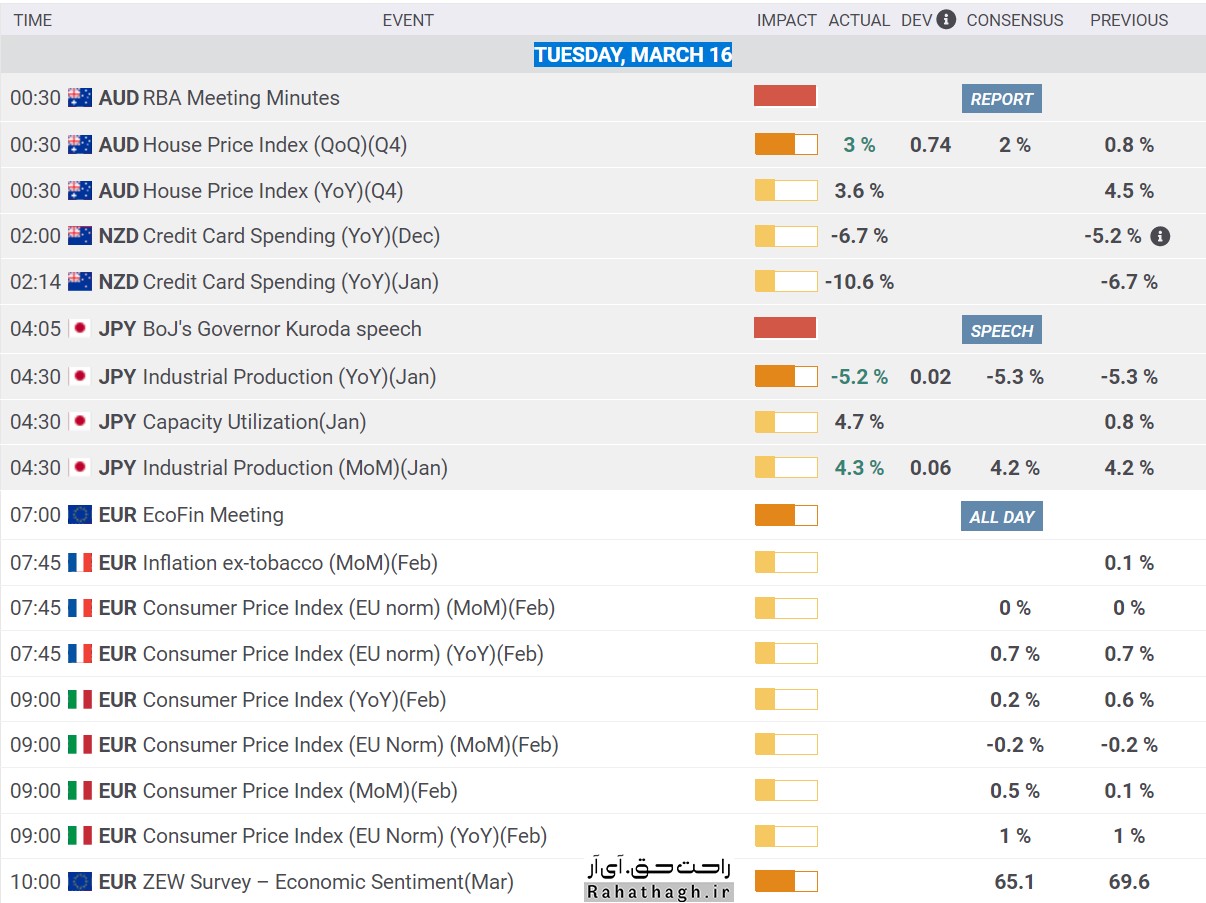
EURUSD analysis Tuesday, March 16
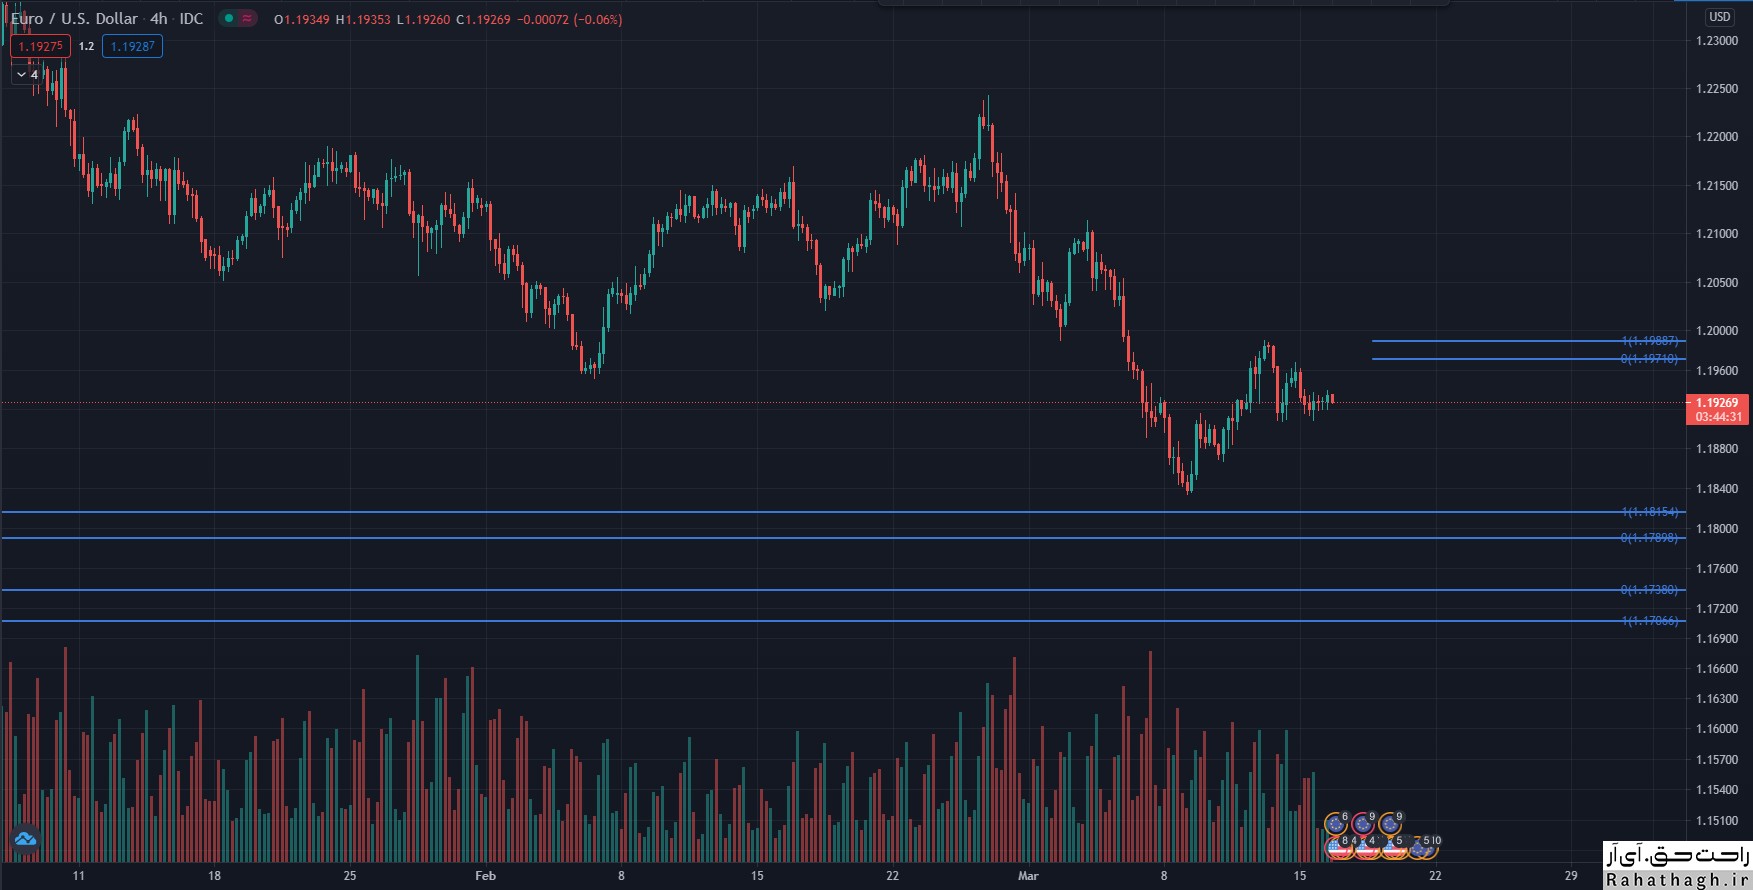
The short-term trend of the euro against the US dollar is neutral. From the buyers' point of view, if the EURUSD pair crosses above the $ 1.89 slight resistance, the 55-day moving average at $ 1,2049 will be the next target of the market. A definite break of these levels will mark the end of the correctional movement starting from $ 1,2348 and the EURUSD will be ready to hit the price peak again. However, from the sellers' point of view, the failure of $ 1,1834 will pave the way for the market to correct 38.2% Fibonacci at $ 1,1694.
Weekly Gold Analysis at Kitco Tuesday, March 16
According to Kitco News, expectations of market participants appear to be changing, and pessimism about the future of the global ounce gold price has eased. The price of an ounce of global gold was able to maintain its position above $ 1,700. Some analysts believe that the XAUUSD market has formed a short-term price floor. As gold prices return from a 10-week low, the optimism of small investors has been boosted by the rise in gold prices. However, market professionals are still pessimistic about the future. This ambiguity has been created in the expectations and desires of micro-investors and professional activists after the rise in crude oil prices and the approval of the US government's financial and support package. Many analysts have said that the US government's financial support package will support the global ounce price of gold in the long run. Others, however, expect the US government fiscal package to drive strong stock market growth and Treasury yields (to the detriment of the gold market).
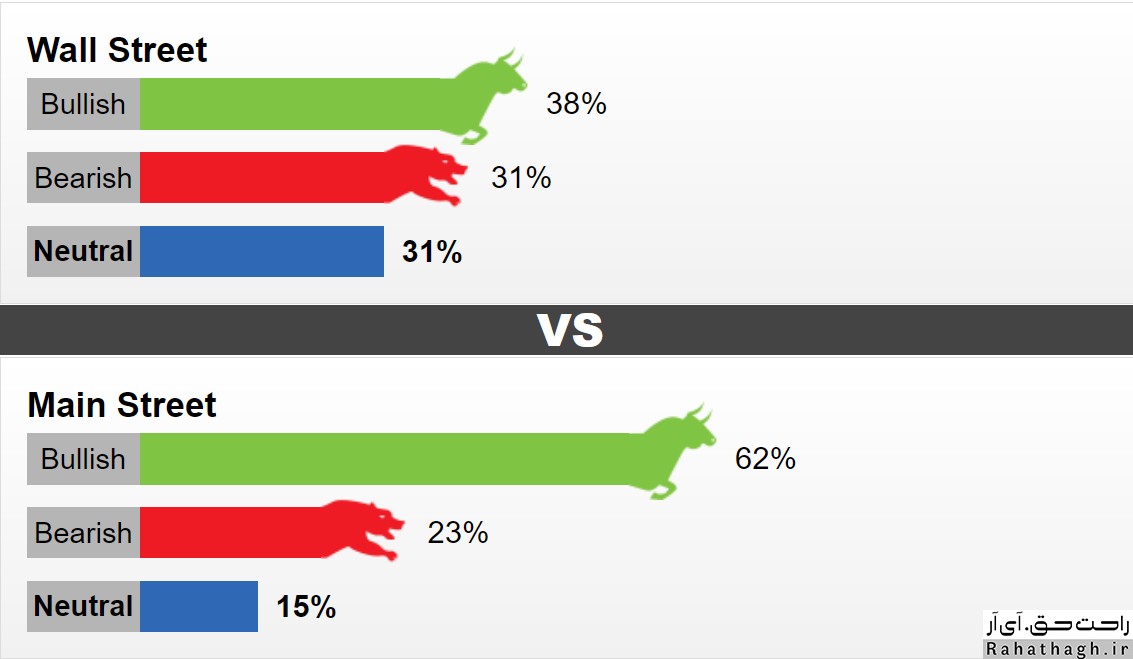
This week, 16 Wall Street activists took part in the weekly evaluation of the Kitco site. 38% predict that the global gold ounce trend will be upward this week. 31% predict that the price of an ounce of global gold will fall. Another 31% expect a trend-free or neutral market. 1611 Main Street investors also took part in an online poll. 62% were in favor of the uptrend, 23% were in favor of the downtrend and 15% were in favor of the market without trend or neutral. Not only are a significant number of small investors optimistic about the medium-term trend in global ounces of gold, but the number of pollsters has reached its highest level in a month.
The views of gold market professionals
Adrian Day, President of Adrian D. Capital Management Company
This professional activist is pessimistic about this week's trend of global gold. He expects prices to fall. However, he predicts that the market is at a price floor and a possible price drop will be the last price drop in the market. "We can expect further price declines from current levels, but prices will continue to rise again (meaning prices will not continue to fall). "But even if the price goes down, I will not be a seller." He went on to say that by injecting high liquidity into the world financial system, being a gold seller is a dangerous job.
Adam Button leads Forexlive.com Currency Strategy Team
This professional activist is also optimistic about the global gold ounce trend. According to him, maintaining support at $ 1680 is a good sign for the upward trend of gold ounces. "The market has learned to cope with high rates of return. "This week's meeting of the US Federal Reserve is also unlikely to change monetary policy."
Colin Cieszynski Senior Market Strategy at SIA Capital Management
The activist believes that the rapid growth of the US economy will make it difficult to raise the price of an ounce of global gold. "I doubt the Federal Reserve will downplay the rapid rise in inflation or try to stop the dollar from appreciating and the rate of return," he said. "I do not think the Federal Reserve, like the European Central Bank, is ready to intervene in the market."
The bitcoin market value is closer to gold, silver and Apple
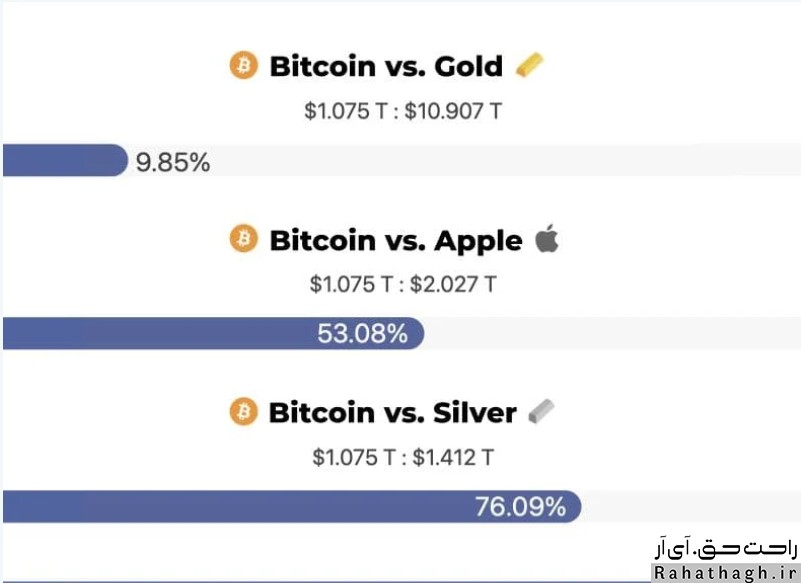
As the bitcoin price continues to rise, the market capitalization of this asset also tries to be as close as possible to the market capitalization of traditional assets such as gold.
Bitcoin now has a market value of $ 1.07 trillion, reaching 9.85% of the market value of $ 10.9 trillion gold. The market value of this cryptocurrency has increased simultaneously with its value since the fourth quarter of 2020. Currently, the market capitalization of this digital currency represents about 53.08% of Apple's $ 2.07 trillion market value. On the other hand, with a market value of $ 1.42 trillion, Bitcoin has been able to reach 76.09% of its market value.
Although Bitcoin is still a long way from reaching the value of the gold market, its proponents believe that as its acceptance by organizations increases, this asset will eventually become a source of excellent value storage.
The resilience of bitcoin and gold was tested during the recession created by the corona pandemic in 2020. The value of bitcoin rose after falling alongside traditional markets in March last year. On the other hand, in August, gold traded above $ 2,000 for the first time, reaching its highest level.
Following the collapse of traditional markets, the situation has strengthened the relationship between gold and bitcoin more than ever. The more people invest in this asset, the more its price will stabilize. It is worth noting that Bitcoin has sufficient liquidity and can be stored with high security with a guaranteed supply limit.
Both assets are out of government control, but gold is in the hands of central banks, and this potentially means manipulating its price. Therefore, Bitcoin proponents believe that the government's lack of control and manipulation of this asset will mean that this asset will eventually overtake gold.
At the same time, Bitcoin fans believe that the market value of Bitcoin will soon even surpass that of Apple. As bitcoin grows in popularity, this could mean wider acceptance in the future.
Micro-investor opinion: Cardano is higher than Bitcoin

According to a recent survey by cryptocurrency broker Voyager Digital, US investors' outlook on Cardano (ADA) is much higher than that of the market's leading cryptocurrency, Bitcoin (BTC).
The company's digital asset investor sentiment poll, first published by the Decrypt news website, shows that 31.9% of investors surveyed are more bullish than Cardano, while 22.2% are BTC. Have been selected instead of ADA. The results came as Cardano hit a record low of $ 1.5 last month, becoming the fourth-largest currency in terms of market value.
Steve Ehrlich, CEO of Voyager Digital, said:
"Sure, everyone is talking about bitcoin these days, but to name Cardano ahead of the currency is really a big surprise."
Ehrlich added that this sentiment reflects the "passion" that the company's users have for cryptographic assets. After Bitcoin, investors had the "most bullish outlook" on Atrium (12.2%) and Polkadat (6.3%). According to him, the results show that the diversity in the cryptocurrency ecosystem has increased, because investors have more assets to choose from.
The survey of 1385 investors in the United States found that most participants expect the price of bitcoin to reach $ 51,000 to $ 60,000 by the end of this month, in addition to the fact that 80% of respondents said they intend to Buy more bitcoins this month.
The results of the Cardano poll were somewhat predictable, as the cryptocurrency has risen more than 500 percent this year, drawing the attention of small investors.
It is worth mentioning that the search for this cryptocurrency also exceeded the highest figure recorded in 2017 last month, and since then, this upward trend has continued. A Google search for a cryptocurrency is often used to assess the interest of small investors in that currency.
Cardano's price has risen to $ 1.11 after a massive correction from its highest price level of about $ 1.5.
An overview of the cryptocurrency market Thursday, March 11
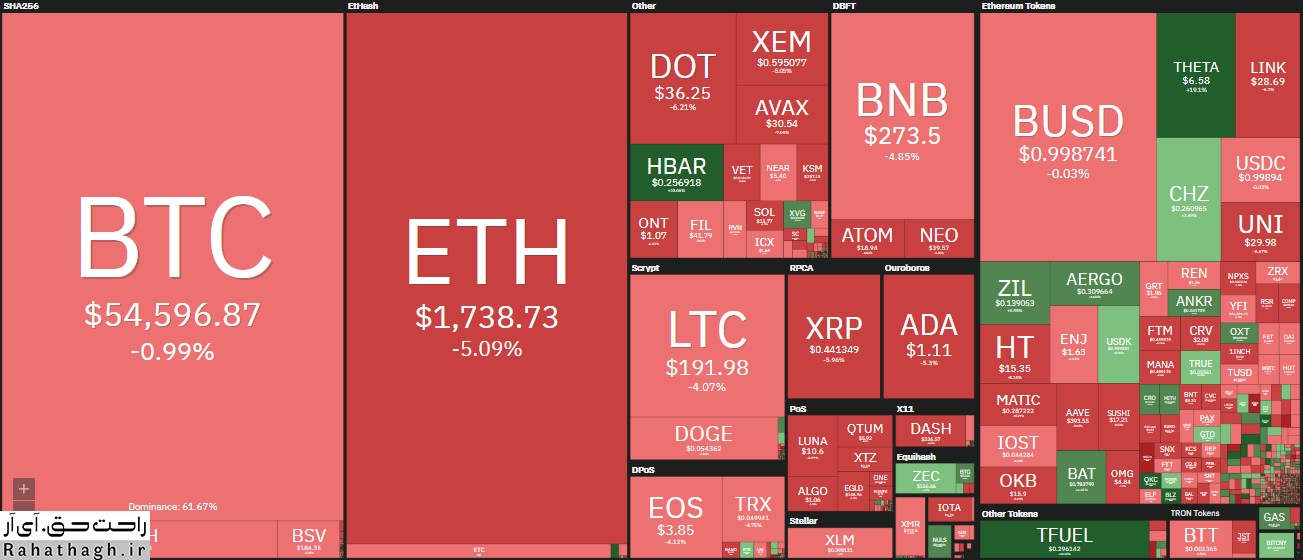
Bitcoin, which was close to the last record set at around $ 1,000, was once again rejected and fell below $ 56,000. However, minor corrections among the Altcoins allowed BTC to regain some of its lost dominance in the market.
Bitcoin was only 2% away from its latest record
Over the past few days, the market's top cryptocurrency has been on the rise after falling to $ 47,000. On the other hand, as organizations became more interested in Bitcoin, its price rose.
The incident hit the $ 50,000 level again, but the cows did not stop at that level, pushing the cryptocurrency to its two-week high of about $ 57,000. According to data released by Bitstamp, the highest daily BTC rate yesterday was around $ 57,400. At this time, the distance between Bitcoin and its highest price level reached about $ 1,000 (1.75%). However, the currency failed to defend this level and reached the current level of $ 55647 following the latest price corrections.
What is remarkable is that the bitcoin market capitalization currently remains well above the $ 1 trillion mark.
Increasing bitcoin dominance
The value of more replacement coins increased with their leader. These developments led Atrium to cross the $ 1,800 mark with a $ 400 increase in one day. However, ETH has fallen slightly since yesterday and is below this sensitive level.
Cardano (-5%), Polkadot (-5%), Ripple (-5.2%), Chainlink (-5.8%) and Uniswap (-5%) have lost some of their value in the last 24 hours.
Binance Coin and Litecoin remain almost unchanged, trading at around $ 275 and $ 195, respectively.
As expected, the situation has been significantly more volatile among low and medium market value altcoins. Meanwhile, Theta Fuel had the best performance with 50% growth. It is followed by Hedera Hashgraph (25%), THETA (19%), Basic Attention Token (15%), Zilliqa (12%) and Bitcoin Gold (11%).
Polygon, on the other hand, fell 10 percent, the biggest drop since yesterday. Avalanche (-9%), Decentraland (-9%), Fantom (-6.5%) and PancakeSwap (-6%) are also in the next ranks.
The relative cessation of large market altcoins has helped bitcoin reassert its dominance in the cryptocurrency market. Thus, the benchmark for comparing the market value of BTC with other altcoins has reached above 61%.
Bainance coin Analysis (BNB) Wednesday, March 10

After forming a support base above the $ 200 level, Bainance coin started a new upward trend. The BNB has broken the $ 220 resistance and recently crossed the $ 250 resistance area.
This paved the way for a Sharpe rally above the $ 275 and $ 285 resistance levels. BNB traded at $ 297 and is currently undergoing correction. Following this correction, the BNB price fell below the correction level of 23.6% Fibonacci uptrend from $ 214 to $ 297.
The currency is still trading above $ 260 and a simple moving average of 100 (4 hours). The cows are strongly protecting the $ 265 and $ 260 support levels. The next major support is near the $ 255 level, which is near the 50% Fibonacci retracement level of the $ 214 to $ 297 uptrend.
The BNB / USDT 4-hour chart shows a major uptrend with support around $ 245. In the uptrend, cows face significant barriers near the $ 285 and $ 290 levels. The main resistance is still close to the $ 300 level, and above that, the BNB is likely to accelerate further in the short term.
If the BNB fails to reach levels above $ 285 and $ 295, it will face a new downtrend. In this case, the first major support is close to the $ 255 level.
The next major support will be close to the $ 245 level and the trend line. If the price falls below the support line of the trend line, there is a possibility that the price will fall to the support area of $ 220.
Technical indicators
The hourly MACD for the BNB / USD pair is gradually accelerating in the uptrend.
The hourly RSI for the BNB / USD pair is above the 50 level.
Main support: $ 265, $ 255 and $ 245
Main resistance: $ 285, $ 295 and $ 300
Atrium Analysis (ETH) Wednesday, March 10

Ethereum is currently on an upward trajectory. The currency was able to overcome the resistance of $ 1850. This Ethereum (ETH) traded at its highest monthly price close to the level of $ 1880 and was just above the simple moving average of 100 (hourly).
Recently, ether started a slight downtrend and traded below the support level of $ 1825. At some point, the price of ether below the correction level of 23.6% Fibonacci broke the uptrend of $ 1649 to $ 1882. Ethereum is now trading below $ 1,800, but is still above the 100-hour moving average.
Ethereum is now testing the $ 1,765 support area. The ETH / USD's hourly chart also shows a major uptrend line with support around $ 1775. The trend line is close to the 50% Fibonacci retracement level of $ 1649 to $ 1882.
In the uptrend, the $ 1800 level is a short-term resistance. The first major resistance is near the $ 1825 level. A break above $ 1825 and $ 1850 could pave the way for the $ 1880 and $ 1900 levels.
If Ethereum fails to continue its uptrend above the $ 1800 and $ 1825 resistance levels, it is likely to face a downtrend. In this case, the first major support near the trend line is at $ 1865.
Currently, the main support is forming near the level of $ 1725 and the simple moving average of 100 (hourly). If the price falls below $ 1725 support, ether may fall to the level of $ 1650.
Technical indicators
The hourly MACD for the ETH / USD pair is gradually accelerating in the downtrend.
The hourly RSI for the ETH / USD pair is below the 50 level.
Main Support: $ 1725
Main resistance: $ 1825