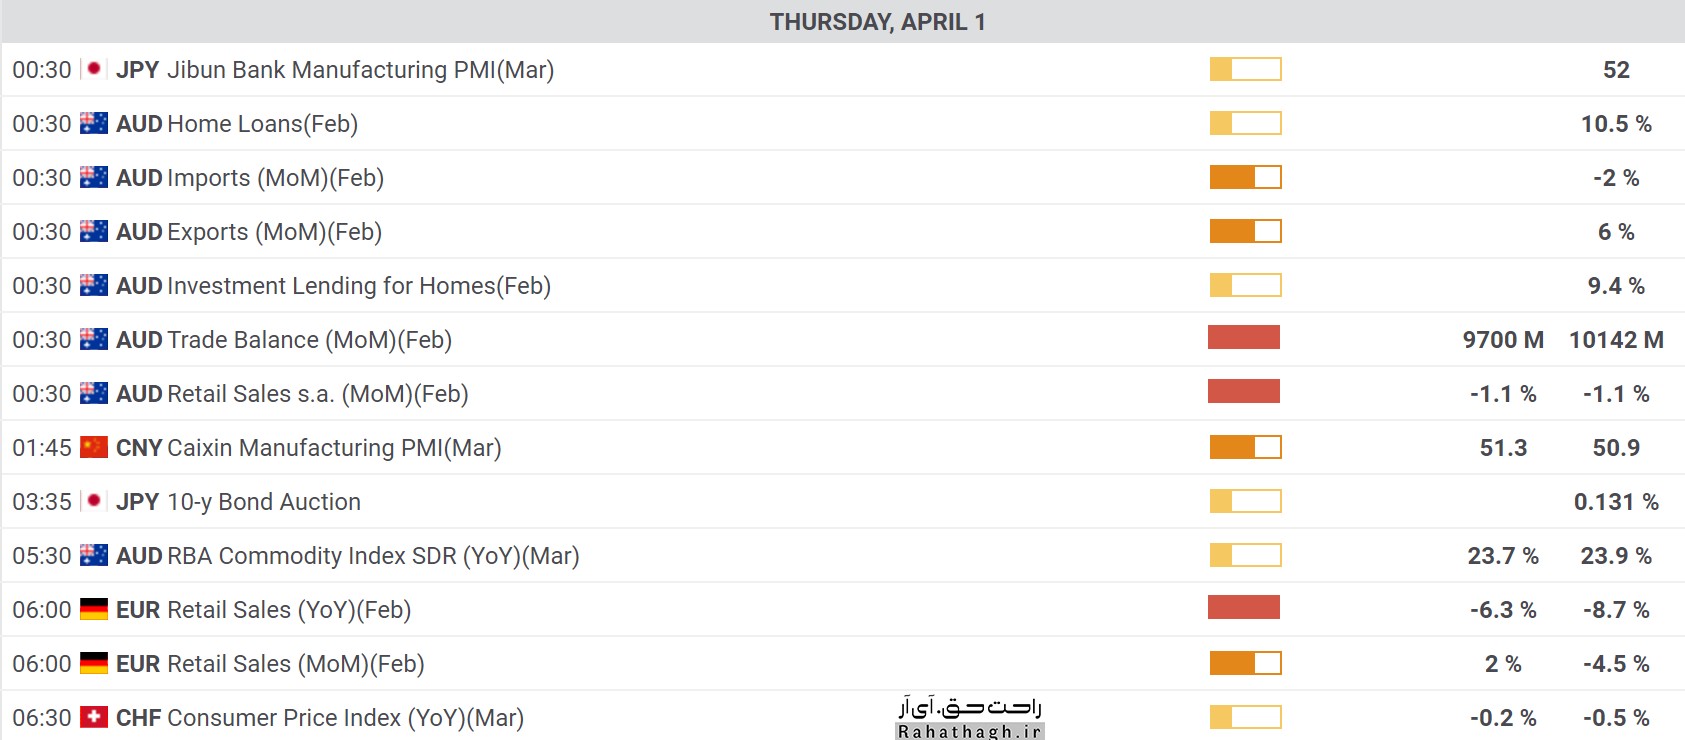
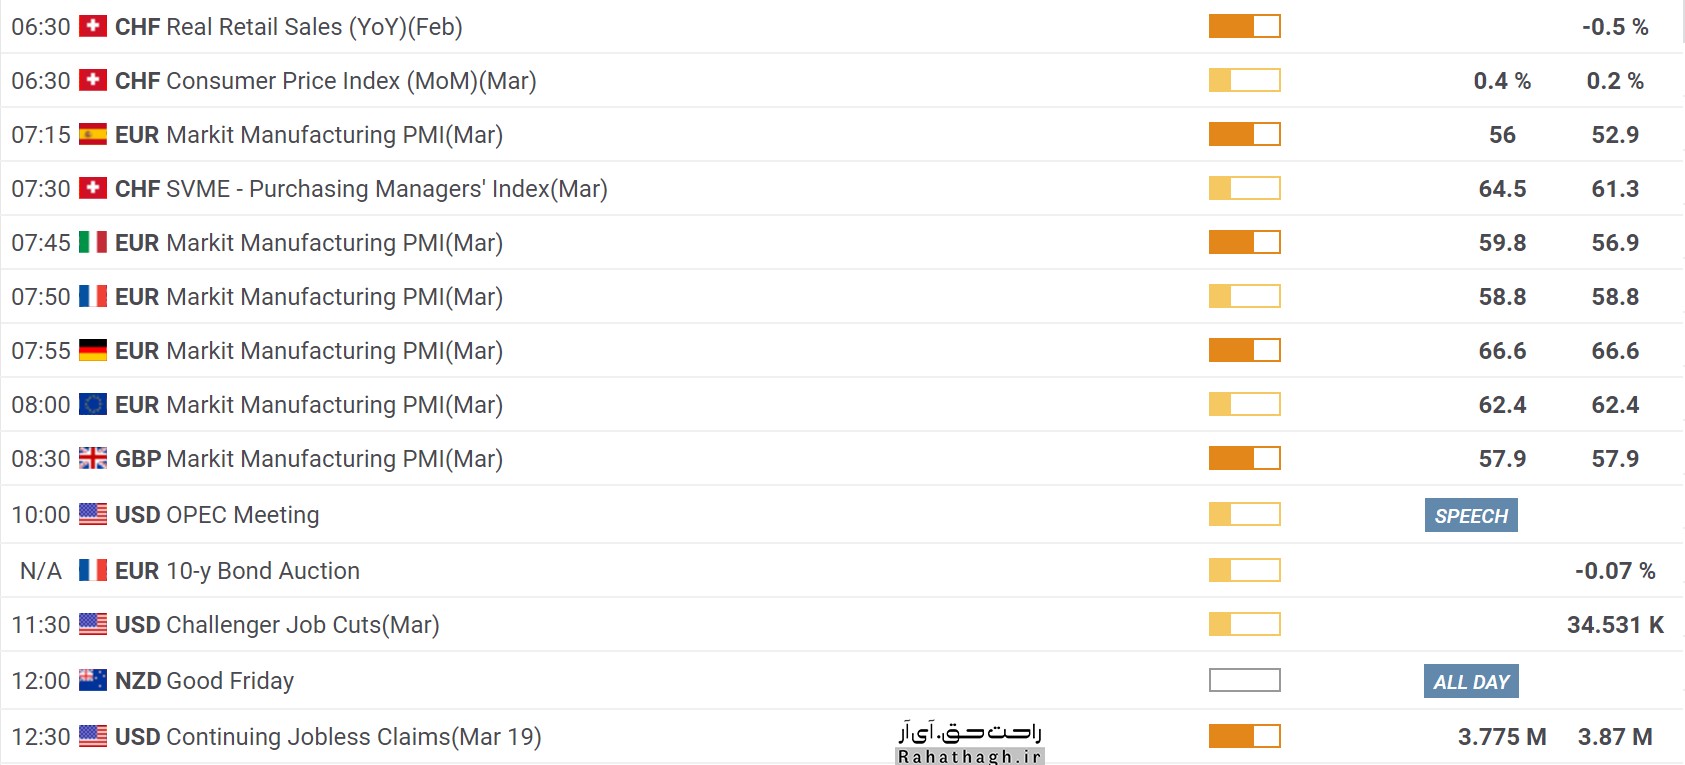
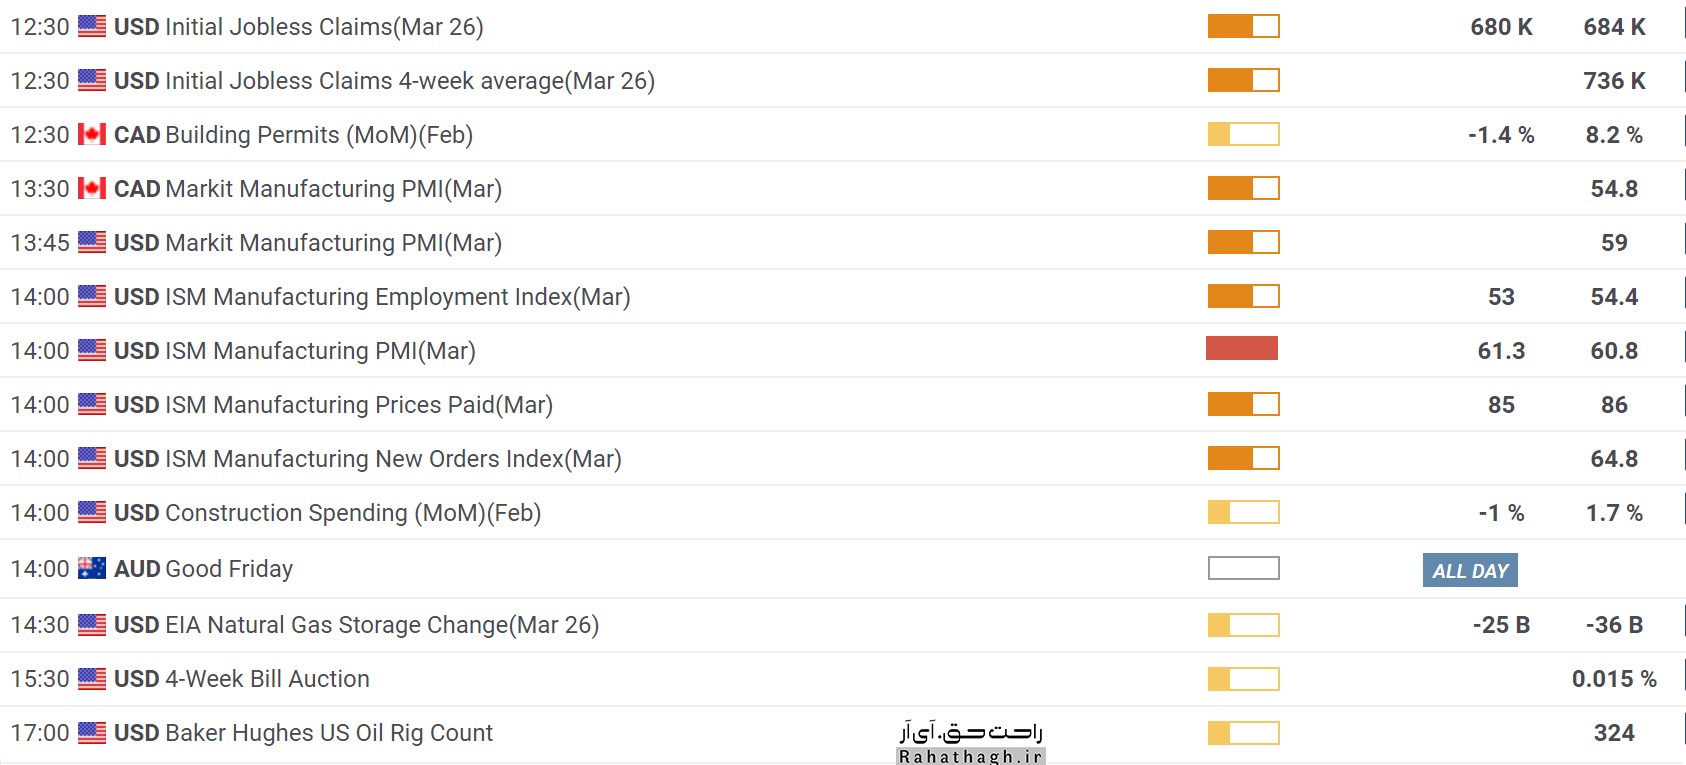
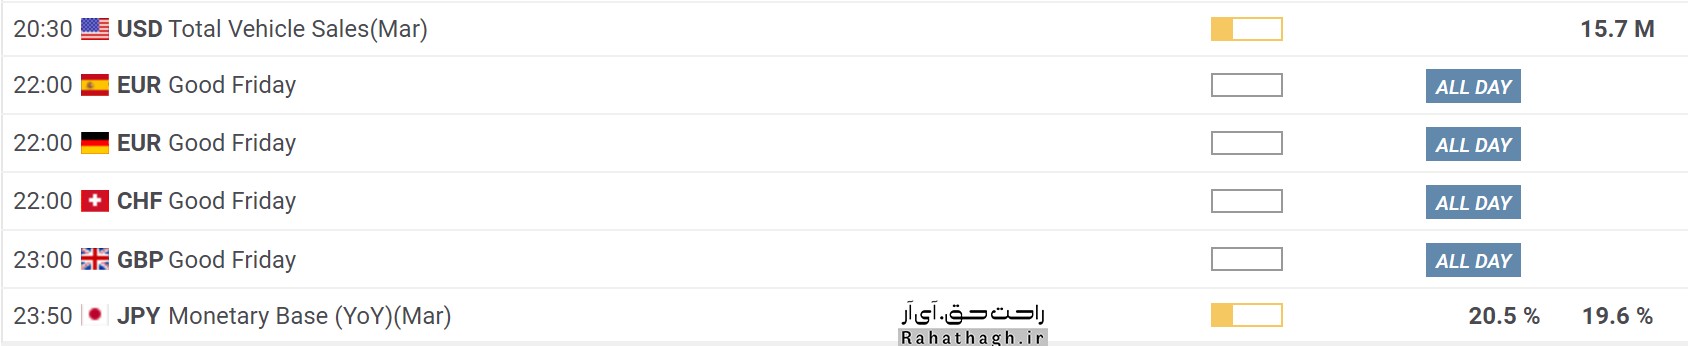
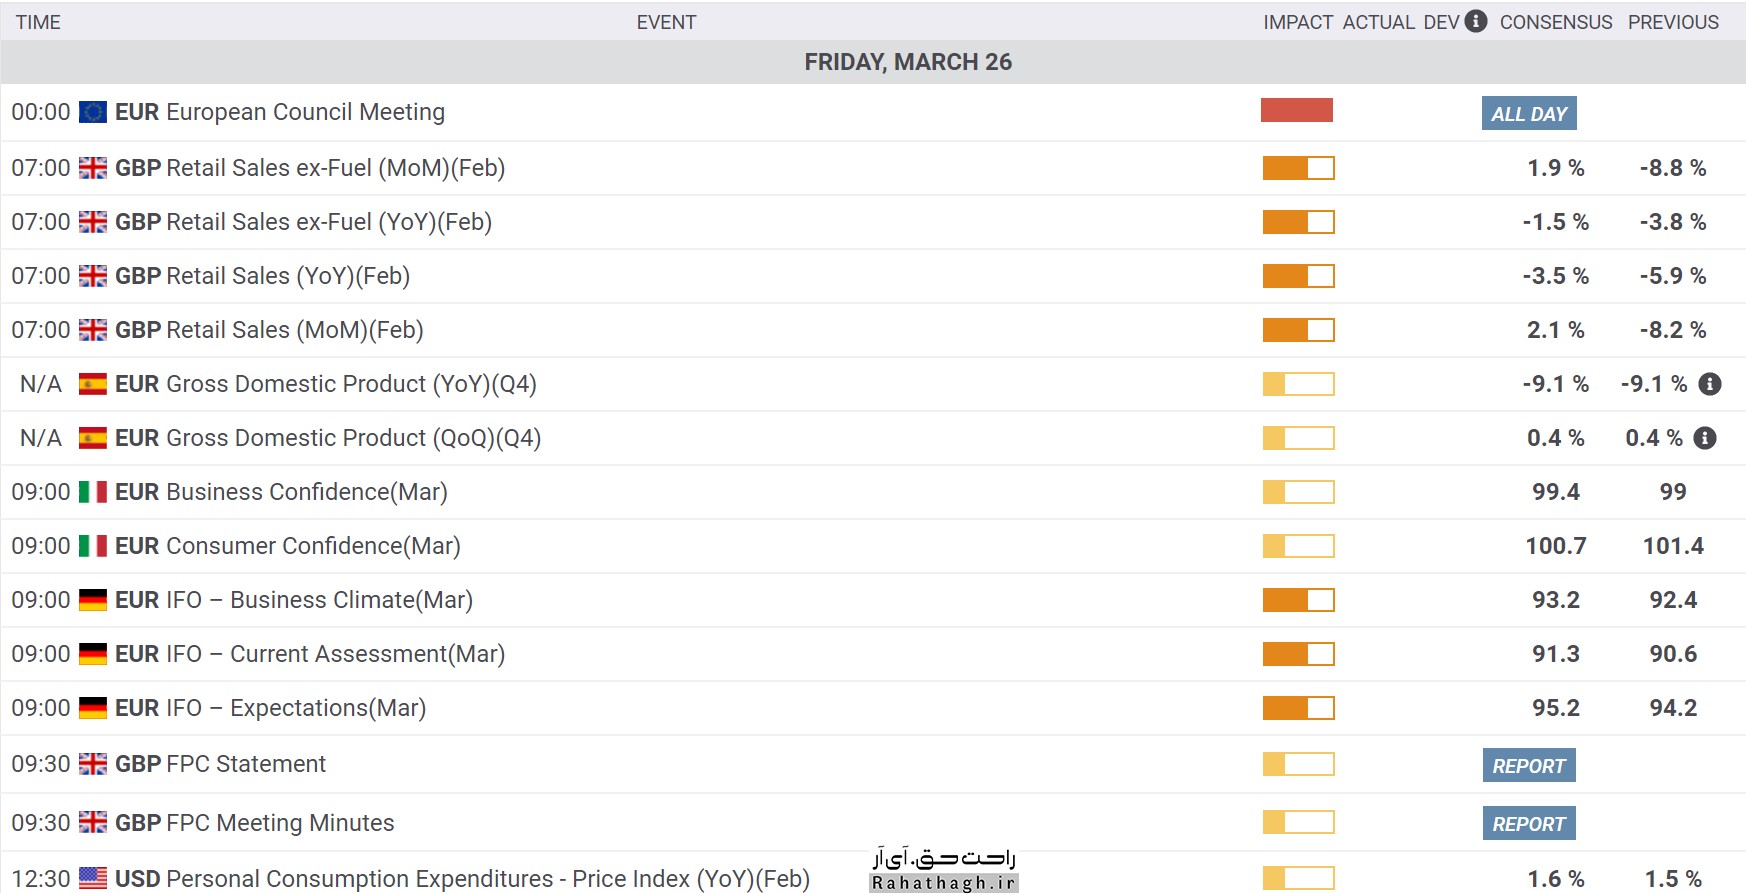
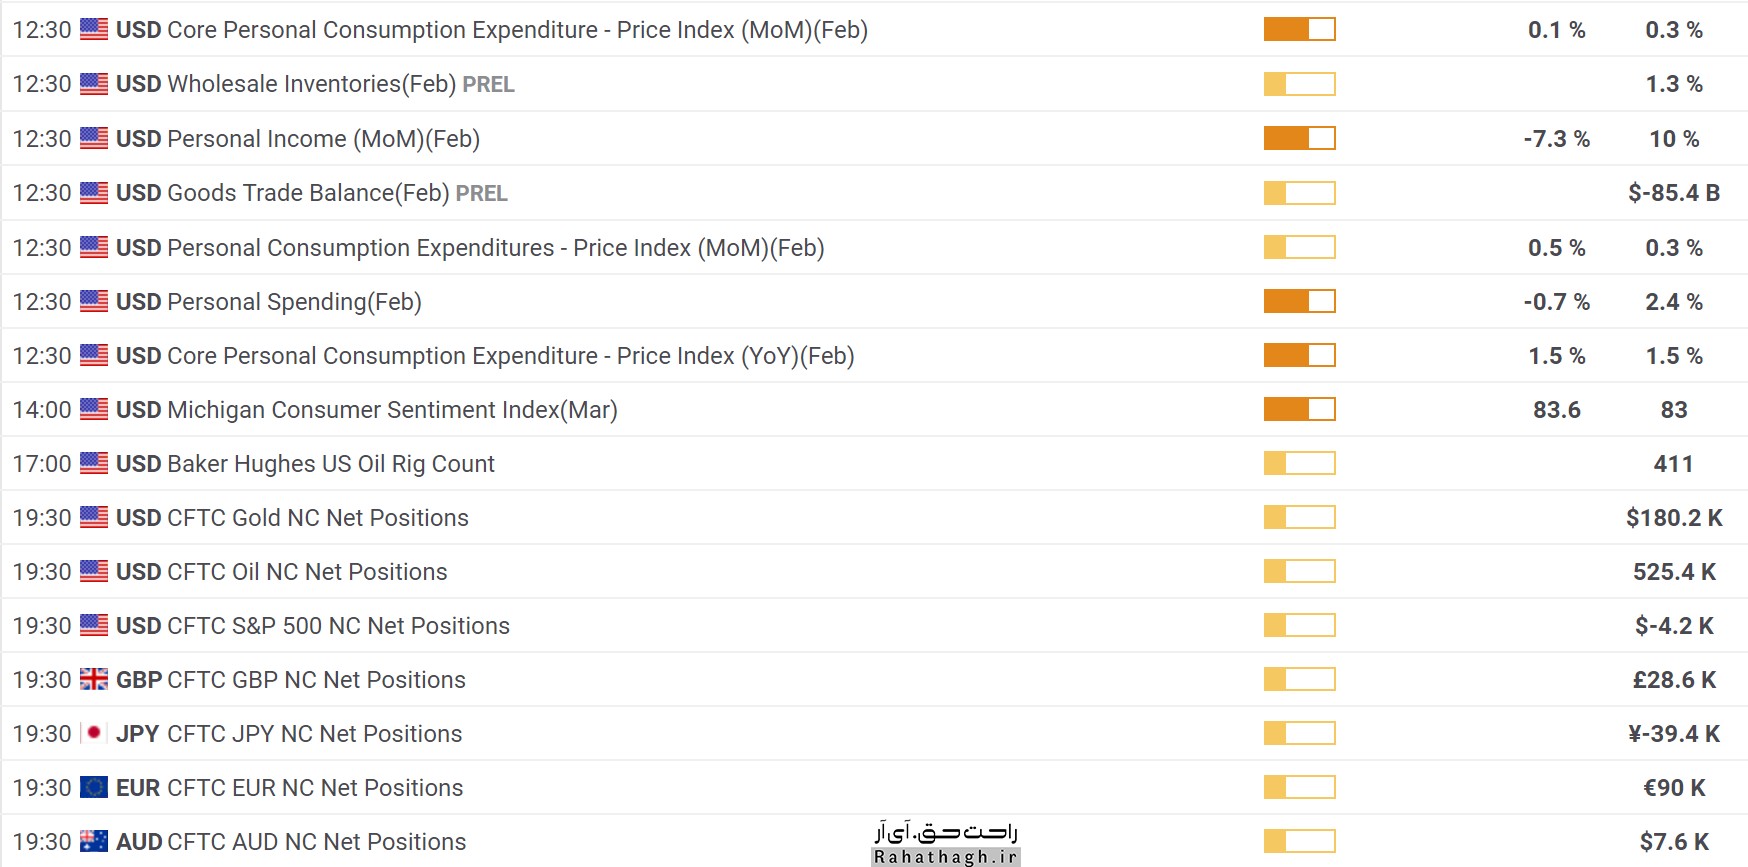
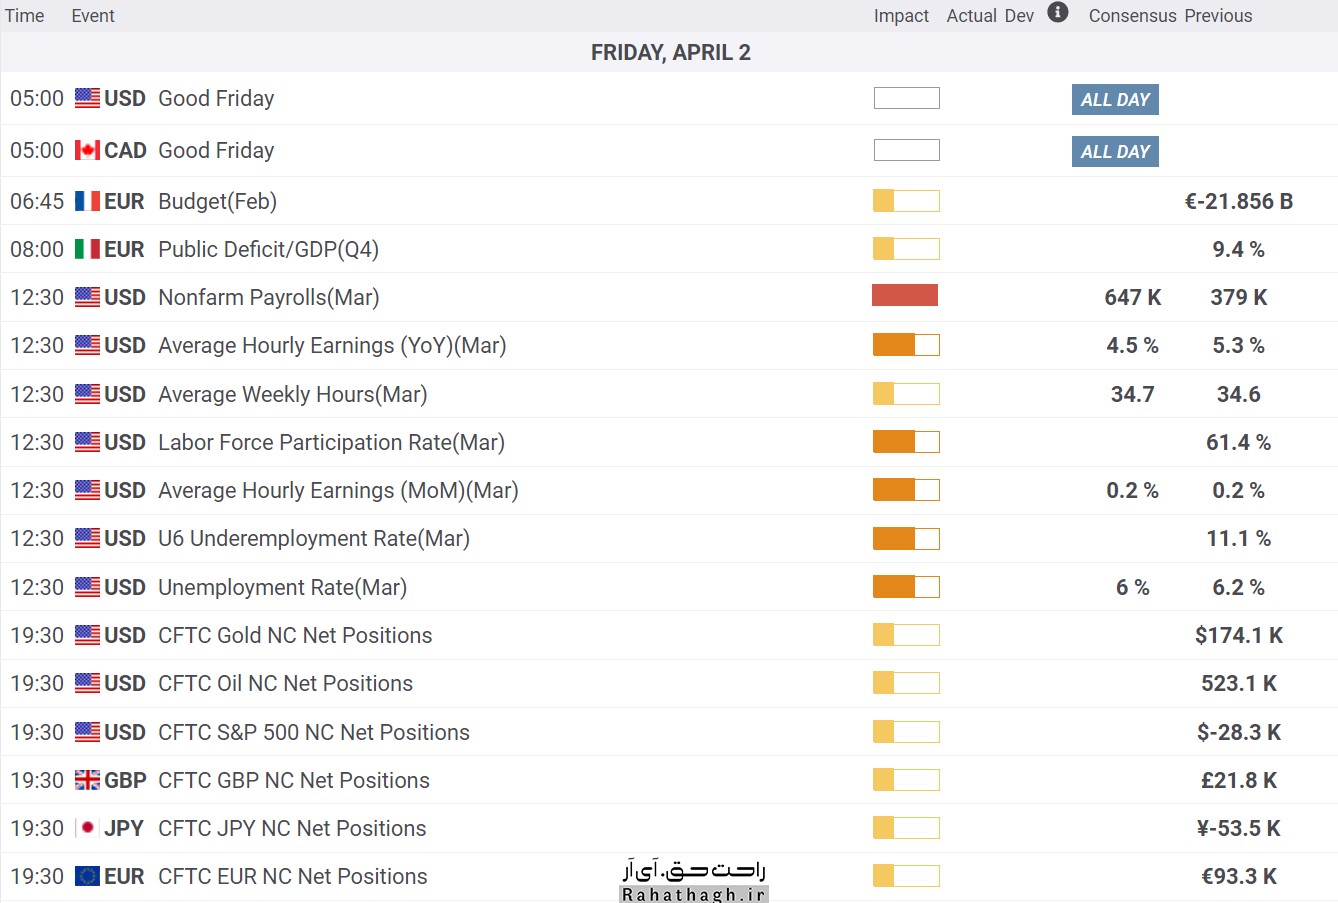
Economic calendar Friday, April 2

US Dollar Index (DXY) Analysis Thursday, April 1
The US dollar index is experiencing a corrective trend after reaching its highest annual level in the range of 93.4 to 93.5 units.
Although in the short term the trend is still bullish, but as we approach the buy saturation zone, there is a possibility that the index will fall to the level of the 200-day moving average indicator in the range of 92 units.
If the index can maintain its position above the level of the 200-day moving average indicator, then we can expect the index to grow in the short term.
Technical levels
Last level of the day: 93.13
Daily fluctuations: 34 pips
Daytime fluctuations (٪): 0.17-
Start: 93.29
Trends
20-day moving average: 92.06
50-day moving average: 91.17
100-day moving average: 91.05
200-day moving average: 92.53
Levels
Yesterday's highest level: 93.35
Yesterday's lowest level: 92.88
Last week's highest level: 92.92
Last week's lowest level: 91.71
Last month's highest level: 91.6
Last month's lowest level: 89.68
Fibonacci 38.2. Daily: 93.17
Fibonacci 61.8. Daily: 93.06
Pivot S1 Daily: 93
Pivot S2 Daily: 92.7
Pivot S3 Daily: 92.52
Pivot R1 Daily: 93.47
Pivot R2 Daily: 93.65
Pivot R3 Daily: 93.94
Transfer of 127 million XRP tokens by Ripple and Bainance Exchange

In the past 24 hours, Ripple and Bainance Exchange, along with a small exchange, have moved 127.3 million XRP tokens (71,858,922) between their wallets, according to the Whale Alert.
The SEC-battered company transferred 39.1 million XRP tokens to Bainance, and then the same amount of XRP was transferred between Ripple wallets.
As reported by U.Today earlier this week and last week, Ripple has been successful in defending its interests in the legal battle against the US Securities and Exchange Commission, which began in late December 2020. .
The first sign of success is that the federal court has agreed to hold a conference call over Ripple's request to force the SEC to produce documents on the insecurity of Bitcoin and Atrium. This event will be held on April 6 (April 17).
The second step forward is that the XRP Association is now legally allowed to intervene in the lawsuit.
Interestingly, Jay Clayton, the former head of the SEC who took legal action against the company, has now joined the One River Asset Management Fund - which deals with digital currencies including bitcoin and ether.
Digital currency exchanges will be assigned by the end of April

By the end of this month, the necessary instructions for digital currency exchanges in free and special economic zones will be announced. During the meeting of the Secretary of the Supreme Council of Free and Special Economic Zones with the Governor of the Central Bank, it was decided to issue the necessary instructions for issuing licenses for the establishment of digital exchange offices in the regions by the end of April, after finalizing and approving the bylaws. Also, regarding the allocation and provision of foreign exchange for the activities of production units and traders, in this meeting it was decided that the necessary coordination be done between the Secretariat of the Supreme Council of Free and Special Economic Zones and the Ministry of Industry, Mines and Trade. Notify this ministry.
Coordination to provide the necessary guarantees for the use of foreign funds was another issue raised at the meeting. Also, the amendment of the decision to establish an offshore bank in order to encourage domestic and foreign investors to establish these banks and to issue a license to establish a digital exchange or Ramzarz exchange in free zones were other issues that were raised at the meeting. Special conditions should be considered for free zones through the Central Bank in order to establish an offshore bank.
The increase in the price of bitcoins and cryptocurrencies in recent months in Iran has also attracted a lot of attention; Last year, the extraction of cryptocurrencies was considered an industrial activity in the country, but their exchange was banned.
In the last days of last year, it was announced that the exchange of cryptocurrencies is unrestricted only for the official extraction of cryptocurrencies for import, but trading in this type of currency between individuals is prohibited. Central bank officials also stressed the ban on cryptocurrency transactions between individuals under the Supreme Council for Combating Money Laundering and a cabinet decision in 1998, in which Shaparak announced to its payers that it would block electronic portals provided by unauthorized businesses, including cryptocurrencies. They will be.
Weekly gold valuation on the Kitco site Wednesday, March 31
The gold market continues to defend support at $ 1,700, but has not yet seen a strong uptrend. According to Kitco News' weekly assessment, the uptrend is almost the same, especially since the price of an ounce of global gold could not cross the key resistance of $ 1750. However, among professional activists, there have been slightly more supporters of the downtrend. However, many analysts believe that a drop in the price of an ounce of global gold could provide a good opportunity for long-term buying.
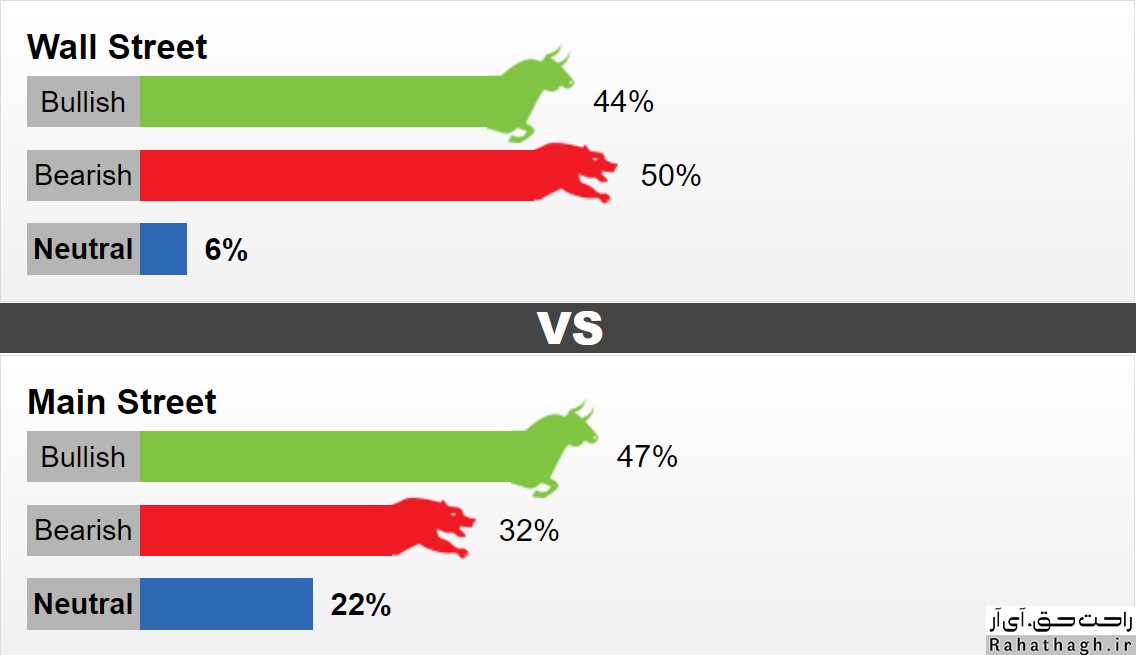
This week, 16 Wall Street activists took part in the weekly evaluation of the Kitco site. 44% predict that the global gold ounce trend will be upward. Another 50 percent expect a downtrend. Another 6% predict that the market trend will be neutral. Meanwhile, 807 Main Street investors took part in an online poll. 47% are in favor of an uptrend, 32% are in favor of a downtrend and 22% are in favor of a neutral trend. Although small investors are a little optimistic about the future of the market, it should be noted that the turnout in last week's poll has reached its lowest level since early May 2020.
The price of an ounce of global gold fluctuates between $ 1,700 and $ 1,750. For many traders, the ounce of global gold futures depends on the trend of the dollar and the yield on US Treasury bonds. US Treasury yields are near a one-year high.
The views of market professionals
Lukman Otunuga Senior Market Analyst at FXTM
"Rapid vaccination in the United States has boosted optimism about rapid economic growth in the United States and boosted demand for the US dollar. If the US dollar continues to rise, the price of an ounce of global gold will fall. Currently the technical situation of the market is in favor of the sellers. Closing the market below $ 1730 will push the price of an ounce of global gold to $ 1700.
Adam Button Leads Forexlive.com Strategy Team
Adam Button has also focused on US dollar fluctuations. "I do not think now is the right time to buy gold. There are positive signs of a growing US dollar. "The strengthening of the US dollar could be to the detriment of gold."
Jim Wyckoff, Senior Technical Analyst at Kitco
Jim Vaikov is the only market analyst who expects a trend-free or neutral market. However, in his view, the market is a bit downward.
Charlie Nedoss Senior Market Strategy at LaSalle Futures Group
The activist believes that as long as the price of gold is above the moving average of 20, he is optimistic about the future of the gold market. The average is around $ 1725. "If the world ounce price of gold can keep the 20-day moving average, we can expect the price of gold to rise above $ 1,750." According to Nodos, the yield on Treasury bonds and the US dollar may have peaked in the medium term. This means that in the medium term, both bond yields and the value of the US dollar will fall and the conditions for the growth of an ounce of global gold will be smoothed out.
Daniel Pavilonis Senior Market Strategy at RJO Futures
This professional activist is optimistic about the medium-term trend of ounces of global gold. According to this professional activist, pessimism about the future of the market has increased and this may be a good opportunity to start buying gold.
the cryptocurrency market Thursday, March 25
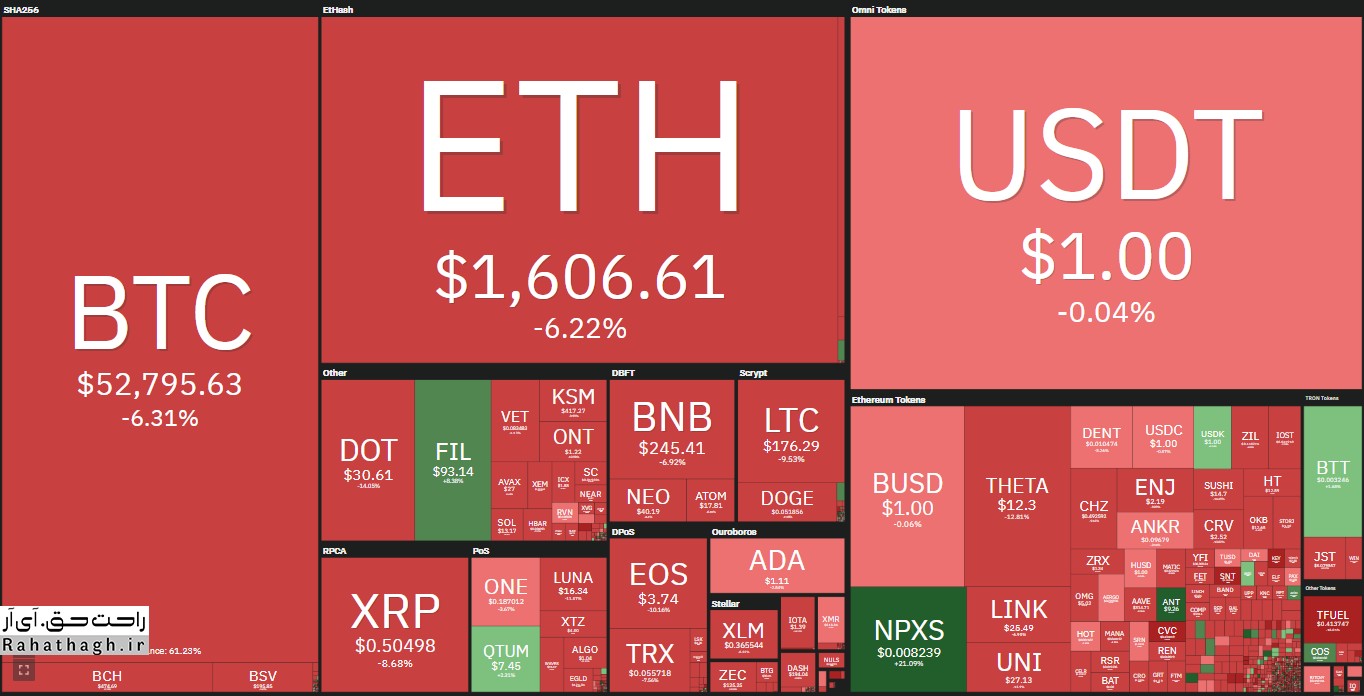
Bitcoin lost more than $ 6,000 in value
The situation seemed to change in favor of this superior currency after the news of the acceptance of Bitcoin by Tesla as a payment option was published. At the same time, however, Bitcoin rose by several thousand dollars to $ 57,000. But since then, Bitcoin has fallen below $ 6,500 to $ 5,500 a day. Despite the return of the price to the level of $ 53,000, Bitcoin still shows a 4% decrease in 24-hour timeframe.
What is more remarkable than the fall in the price of Bitcoin is the devaluation of the currency below $ 1 trillion. According to Bybt data, the increase in fluctuations since yesterday has led to a decrease of more than $ 2 billion in the total market value of this currency.
Altcoins drown in a sea of blood
After a few days of margin trading, the Altcoins market situation looked good yesterday with slight gains. Atrium pioneered this growth, rising to $ 1,700 and $ 1,740. However, the situation has changed completely in the last 24 hours. The sudden drop of $ 200 in the price of ETH caused this asset to reach its daily low price of $ 1550 a few hours ago. Since then, ETH is still below $ 1,600, down more than 6 percent.
Today, red dominates other altcoins. Binance Quinn (5%) and Cardano (2.5%) reached $ 245 and $ 1.1, respectively.
Polkadat fell 13% to $ 31, Ripple (-10%) fell below $ 0.5, (11.5%) to $ 27, LightQueen (-9%) to $ 175 and Theta (-18%) to around $ 12. .
Theta Fuel (-24%), IOTA (-15%), Ontology (-13%), Phantom (-12%), OMG Network (-12%), Flow (-12%), Ren (-12%) , SushiSwap (-12%) and 0x (-11%) are other fallout altcoins today.
Finally, the cumulative capital of the cryptocurrency market fell by $ 150 billion to $ 1.620 trillion.
Gold Analysis Thursday, March 25

The price of the global ounce of gold fluctuated around $ 1,735 at the beginning of Thursday and has not yet managed to cross the $ 5 range. The price is currently fluctuating within the indicator of the 200-hour moving average and is nearing the end of the symmetrical triangle pattern.
Given the low volatility trend of the RSI indicator, one can expect the price to move only if the resistance of $ 1,738 or support of $ 1,725 is broken. On the other hand, the 78.6% Fibonacci level at $ 1,720 and the monthly price ceiling at $ 1,755 play the role of support and resistance levels, respectively.
If the price fails to maintain the corrective trend at the beginning of March and the US dollar index grows, then sellers will be able to control the market for a longer period of time.
Technical levels
Last price of the day: $ 1734.48
Daytime fluctuations: 0.48-
Daytime fluctuations (٪): 0.03-
Starting price: $ 1734.96
Trends
20-day moving average: $ 1726.26
50-day moving average: $ 1787.01
100-day moving average: $ 1826.41
200-day moving average: $ 1860.65
Levels
Yesterday's highest price: $ 1738.48
Yesterday's lowest price: $ 1723.86
Last week's highest price: $ 1755.59
Last week's lowest price: $ 1719.3
Last month's highest price: $ 1871.9
Last month's lowest price: $ 1717.24
Fibonacci 38.2. Daily: $ 1732.9
Fibonacci 61.8. Daily: $ 1729.44
Pivot S1 Daily: $ 1726.39
Pivot S2 Daily: $ 1717.81
Pivot S3 Daily: $ 1711.77
Pivot R1 Daily: $ 1741.01
Pivot R2 Daily: $ 1747.05
Pivot R3 Daily: $ 1755.63
Bitcoin Analysis Thursday, March 25

Yesterday, Bitcoin was able to reach levels above $ 55,500 and $ 56,000 with the start of a proper recovery process. BTC even crossed the $ 57,000 resistance and the simple moving average of 100 (hourly).
However, the currency failed to continue its uptrend further, and as a result, resumed its downward trend after forming a price ceiling at $ 57,235. In the hourly chart of the BTC / USD pair, a price break is seen below a major uptrend line with support near $ 54,220.
The price of Bitcoin fell even below the support level of $ 54,000 and the pivot level of $ 53,200. Following this downward trend, the weekly price floor formed around the level of $ 51634 and bitcoin entered the consolidation phase. The first resistance is near the level of $ 53,000, which is near the correction level of 23.6% Fibonacci, the downward trend of $ 57,235 to $ 51634.
The first major resistance to this market cryptocurrency is near the $ 53,200 pivot level. If we see the price rise again above the $ 53,200 level, the probability of reaching the $ 54500 level increases. The 50% Fibonacci retracement level is down from $ 57,235 to $ 51634 and close to $ 54500.
If the bitcoin correction trend does not lead to levels above $ 53,200 and $ 545,500, in the short term it is more likely to continue its downward trend. In this case, the first support will be close to the level of $ 51,500.
The first major support is now close to the $ 51,000 level, below which the $ 50,000 support area is likely to be touched. Any further price cuts could lead to a move to the $ 48,000 level.
Technical indicators
The hourly MACD for the BTC / USD pair is slowly accelerating in the downtrend.
The hourly RSI for the BTC / USD pair is now below the 40 level.
Main support: $ 51,000 and $ 50,000
Main resistances: 53200, 54500 and 55000 dollars