
Check the gold trend Monday, March 8
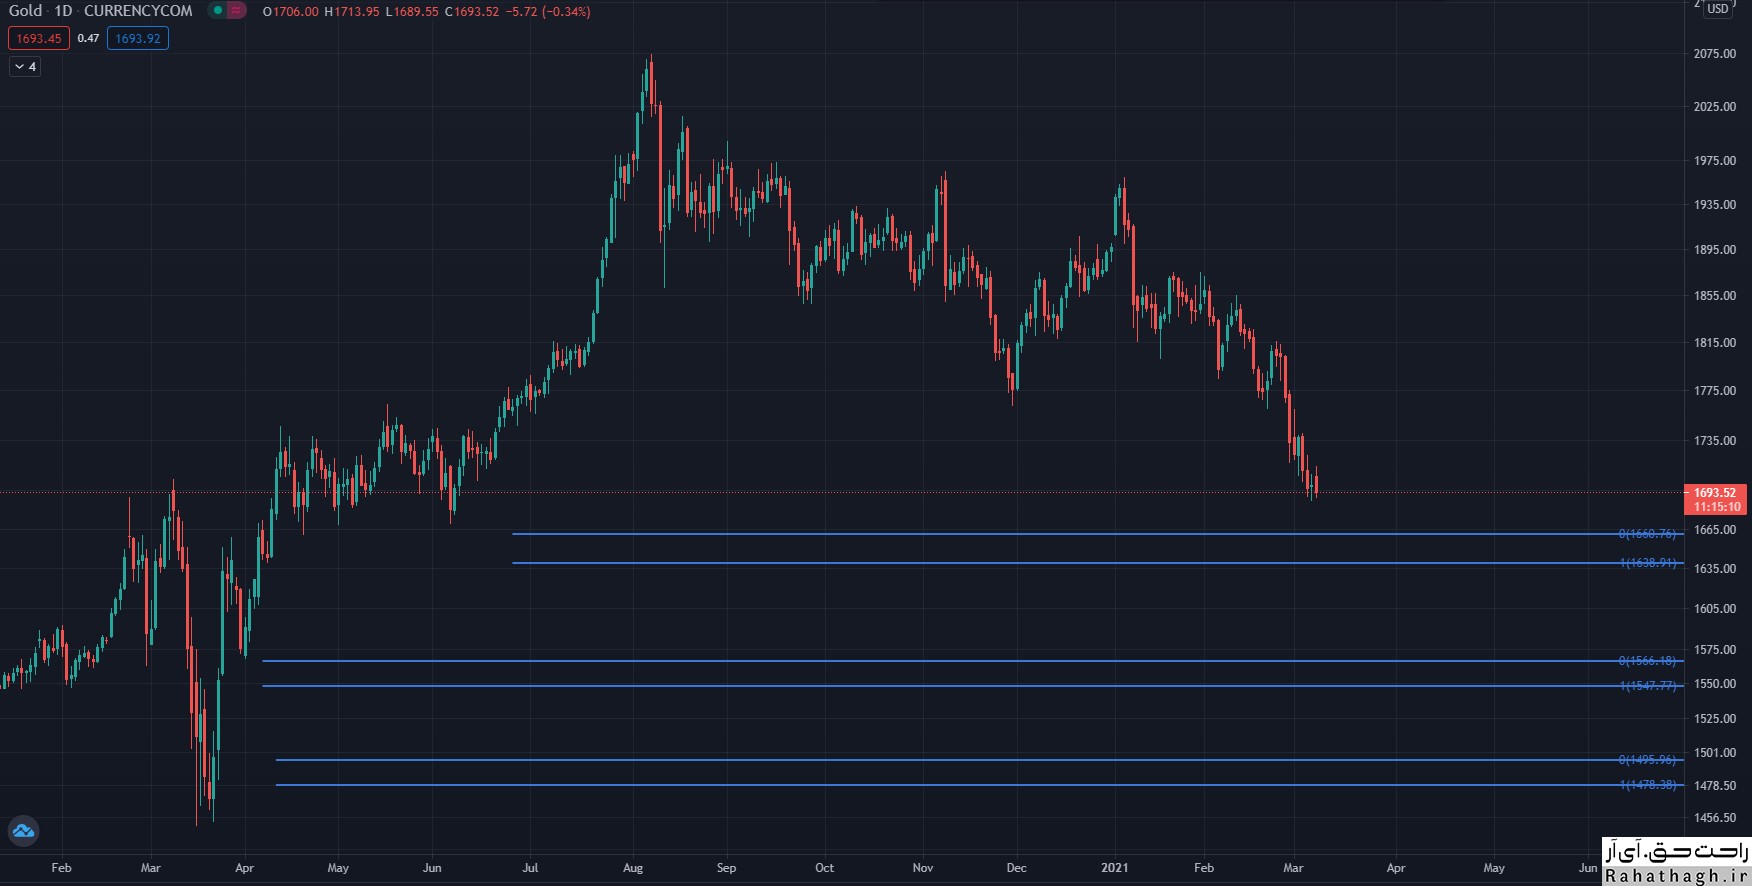
The global ounce price rose 0.57% to $ 1,708 as Monday's trading session in Europe approached. Thus, the price of gold has started to rise from its 9-month low.
Given the RSI indicator reached the sell-off zone and the formation of a Dodge candlestick pattern on Friday, there is a possibility that this corrective trend will continue.
However, the bearish trend line since November 30 at $ 1,760 is a resistance.
Meanwhile, the $ 1,700 level plays the role of the first important support that if the price penetrates below this level, we can expect a fall to the downtrend line formed on August 12 at $ 1,677.
If the $ 1,677 support is broken, the price of gold will fall to the level of $ 1,670 and eventually to $ 1,610.
Technical levels
Last price of the day: $ 1707.8
Daily fluctuations: 9.6
Daytime fluctuations (٪): 0.57
Starting price: $ 1698.2
Trends
20-day moving average: $ 1779.02
50-day moving average: $ 1829.15
100-day moving average: $ 1848.59
200-day moving average: $ 1860.11
Levels
Yesterday's highest price: $ 1707.26
Yesterday's lowest price: $ 1687.37
Last week's highest price: $ 1759.98
Last week's lowest price: $ 1687.37
Last month's highest price: $ 1871.9
Last month's lowest price: $ 1717.24
Fibonacci 38.2. Daily: $ 1699.97
Fibonacci 61.8. Daily: $ 1695.16
Pivot S1 Daily: $ 1687.89
Pivot S2 Daily: $ 1677.39
Pivot S3 Daily: $ 1667.4
Pivot R1 Daily: $ 1708.18
Pivot R2 Daily: $ 1718.17
Pivot R3 Daily: $ 1728.57
