ارزیابی |هفتگی سایت کیتکو^ درباره روند طلای جهانی ((GOLD))

بر اساس ارزیابی هفتگی سایت کیتکو(Kitco) توقعات و پیش بینی معامه گران حرفه ای بازار کاملا تغییر کرده است. در این بین رئیس فدرال رزرو گفته است که اقتصاد آمریکا به پیشرفت قابل قبولی نرسیده است، تا فدرال رزرو خرید اوراق قرضه را قطع نماید. این سخن رئیس فدرال رزرو ایالات متحده به این معنی است که، فدرال رزرو احتمالا به سیاستهای انبساطی پولی ادامه می دهد.
قیمت طلای جهانی در معاملات هفته گذشته رشد کرد و به نزدیکی اوج قیمتی شش هفته اخیر خود رسید. در بررسی هفتگی سایت کیتکو هم هیچ کدام از فعالین حرفهای بازار منتظر کاهش قیمت طلای جهانی نیستند. نظر فعالین حرفه ای بازار این نکته را می رساند که از نظر بازار، فدرال رزرو بیش از حد انتظار متمایل به سیاستهای انبساطی پولی است.
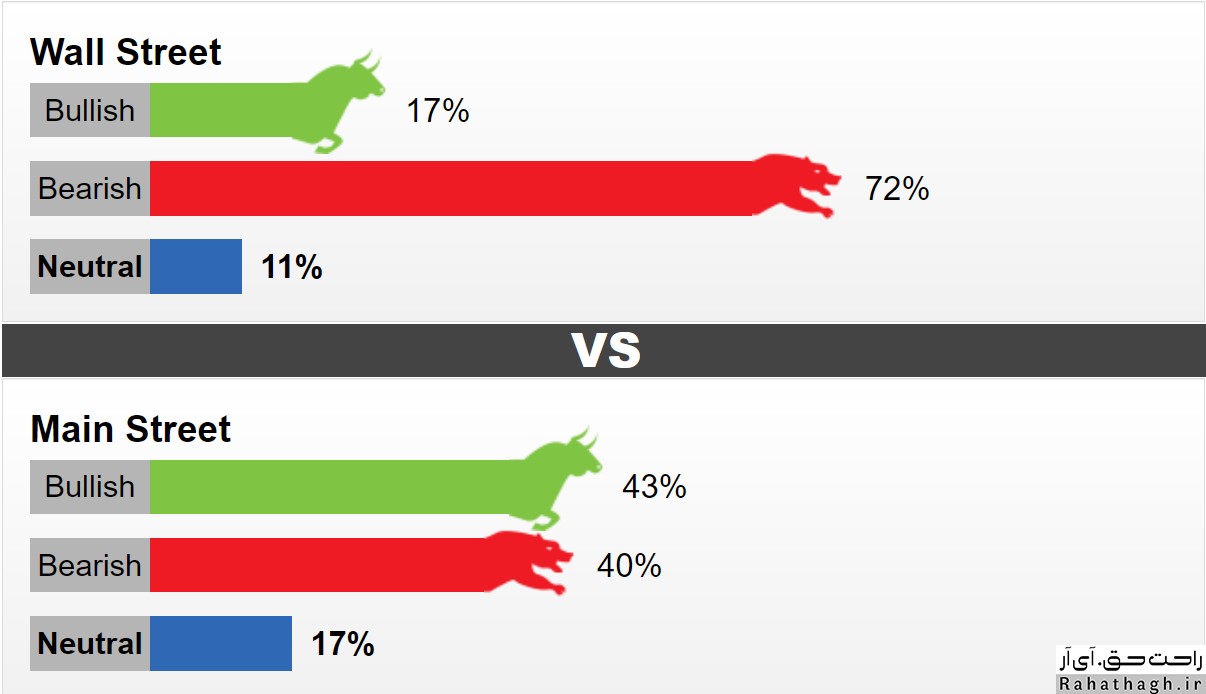
در این هفته ۱۴ فعال حرفهای (Wall Street) در ارزیابی هفتگی شرکت کردند. در این بین ۷۹ درصد انتظار دارند که قیمت طلای جهانی صعودی باشد. ۲۱ درصد نیز انتظار دارند که بازار بدون روند یا خنثی باشد. همچنین هیچ کدام از فعالین حرفه ای شرکت کننده در این نظرسنجی انتظار روند نزولی در معاملات هفته پیش رو را نداشتند. لازم به توضیح است که در ارزیابی هفته گذشته، ۶۰ درصد فعالین حرفهای انتظار روند نزولی را داشتند. در عین حال ۸۶۲ سرمایهگذار خرد (Main Street) نیز در نظرسنجی آنلاین شرکت کردهاند. ۷۰ درصد طرفدار روند صعودی، ۱۸ درصد طرفدار روند نزولی و ۱۲ درصد هم طرفدار بازار بدون روند یا خنثی بودند.
نظر کارشناسان حرفه ای بازار در مورد روند طلا در هفته پیش رو
دیوید مدن (David Madden) تحلیلگر بازار در Equiti Capital
این فعال حرفهای انتظار دارد که قیمت اونس طلای جهانی به سیر صعودی خود ادامه دهد، چونکه دلار آمریکا تحت فشار قرار دارد. از نظر او، دادههای اقتصادی روز پنجشنبه گذشته که نشانگر رشد ضعیف ۶٫۵ درصدی GDP آمریکا بودند، میتوانند دلار آمریکا را حداقل در میانمدت تضعیف کنند. رشد تولید ناخالص داخلی آمریکا در سهماهه دوم سال ۲۰۲۱ خیلی ضعیفتر از پیشبینی اقتصاددانان بود. اقتصاددانان انتظار رشد ۸٫۵ درصدی را داشتند.
دارین نیوسام (Darin Newsome) تحلیلگر مستقل
طلا با وجود رالی صعودی اخیر در فاز خنثی معامله میشود. از نظر این فعال حرفهای، طلا بین ۱۸۳۹ و ۱۷۹۳ دلار در نوسان است. بازار با ابهامات زیادی مواجه است. اگر طلا در معاملات هفته پیش رو بتواند از این فاز خنثی خارج شود، تنها به خاطر واکنش به دادههای اشتغال ماه ژوئیه خواهد بود.
کولین سیزینسکی (Colin Cieszynski) استراتژیست ارشد بازار در SIA Wealth Management
من فکر میکنم که دلار آمریکا در کوتاهمدت تضعیف خواهد شد، اما شاید در ادامه معاملات ماه اوت بالا جهش کند.
آدام باتن (Adam Button) استراتژیست ارشد بازار در Forexlive.com
این فعال حرفهای هم انتظار تضعیف ارزش دلار آمریکا را دارد. از نظر او تضعیف ارزش دلار به افزایش قیمت طلا کمک خواهد کرد. “دلار آمریکا تحت فشار قرار دارد. فشارهای تورمی تضعیف شدهاند و فدرال رزرو آمریکا هم میخواهد به جای خروج از سیاستهای انبساطی، صبر کند. اروپا هم توانسته بهتر از پیشبینیهای قبلی با بحران کرونا مقابله کند.”
رشد GDP خیلی ضعیف بوده و من فکر میکنم که فدرال رزرو باید فعلاً از قطع برنامه خرید اوراق قرضه صرفنظر کند و به سیاستهای انبساطی و حمایتی ادامه دهد. من نمیخواهم فروشنده دلار آمریکا باشم، اما دلار به وضعیتی رسیده که دیگر نمیتواند به رشد خود ادامه دهد. با تضعیف ارزش دلار آمریکا، قیمت اونس طلای جهانی میتواند تا ۱۹۰۰ دلار بالا بیاید. در عین حال بایستی توجه داشت که من انتظار حرکات صعودی و بزرگی از بازار طلا ندارم.
آدریان دی (Adrian Day) رئیس شرکت مدیریت دارایی
شواهد نشان میدهند که بانکهای مرکزی بزرگ دنیا مثل فدرال رزرو آمریکا عجلهای برای خروج از سیاستهای انبساطی پولی ندارند. فدرال رزرو با وجود بحث ها در رابطه با کاهش خرید اوراق قرضه، به افزایش ترازنامه خود ادامه میدهد. این خبر خیلی خوبی برای بازار طلاست. افزایش نقدینگی باعث تضعیف ارزی مثل دلار میشود و در نتیجه قیمت اونس طلای جهانی افزایش مییابد. در واقع سرعت عرضه پول از عرضه طلا پیشی میگیرد و طبق قضیه کمیابی، طلا با ارزشتر میشود.
 The upward trend in