صفحه اصلی تقویم اقتصادی تحلیل رمزارزها (Cryptocurrency) تحلیل طلا (Gold) تحلیل فارکس (Forex) ارتباط با من درباره من
حمید::راحت حق :: سایت تحلیل بورس، فارکس و ارز دیجیتال حمید راحت حق| Rahathagh.ir

اخبار و تحلیل نموداری و تکنیکالی بازارهای مالی دنیا اعم از بازار بورس داخلی، بازار فارکس، بازار طلا و بازار ارز دیجیتال و رمزارزها و روانشناسی بازار

۶ مطلب با کلمه‌ی کلیدی «حمید::راحت حق» ثبت شده است

Stellar Analysis (XLM) Monday, April 19

Stellar Analysis (XLM) Monday, April 19

https://s18.picofile.com/file/8431207700/stellar_19_4_%D8%B1%D8%A7%D8%AD%D8%AA_%D8%AD%D9%82.jpg

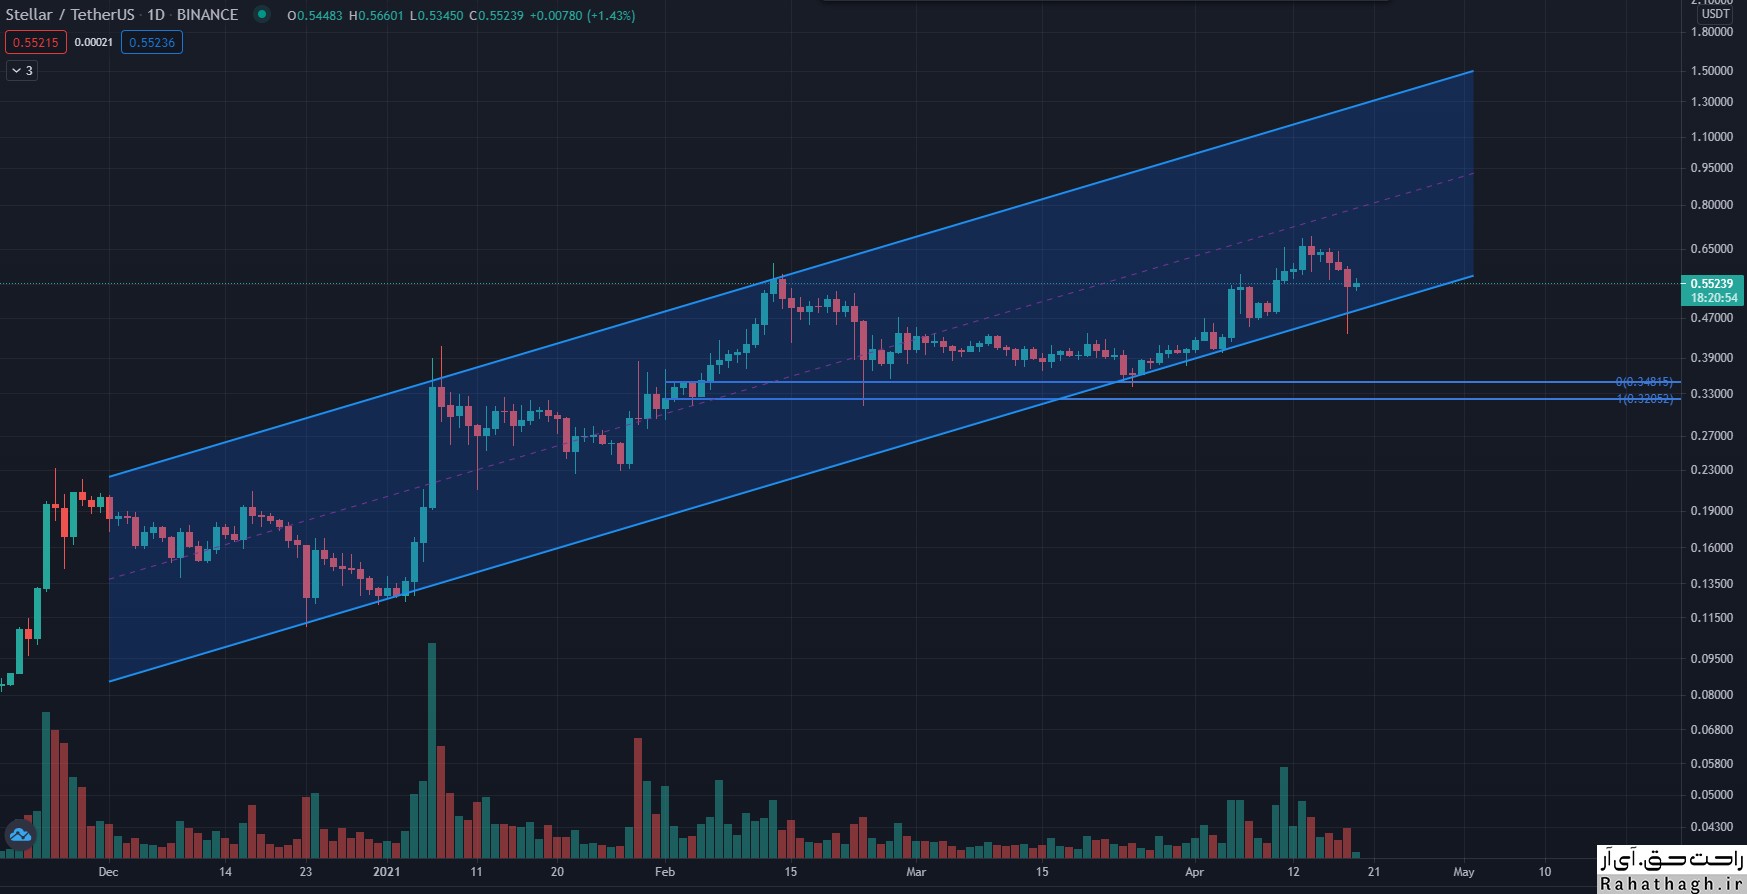
The price of Stellar Digital Currency has been fluctuating within the range of an uptrend channel for five months.


The price has been in the range of an uptrend channel in daily timeframe since the end of November 2020, and now with the price hitting the bottom trend line of this channel during the recent fall, there is a possibility of an uptrend and price correction.


The recent drop in prices caused the Stellar market value to fall by 27%. However, as prices fall below the uptrend channel, we see new activity from buyers.


The last two times the price has hit the bottom of this channel, we have seen an upward trend. Currently, one can expect the price to rise to $ 1.42 in the range of 127.2% Fibonacci.


However, investors must first wait for the price to react to the 50-day moving average indicator. It is also important to break the resistance level of $ 0.58 to $ 0.69 to form an uptrend.


On the other hand, if the price penetrates below the bottom trend line of the uptrend channel at $ 0.40, the probability of a fall in price increases.
In this case, you can expect a 13% drop to $ 0.34.

۳۰ فروردين ۰۰ ، ۱۰:۱۴
حمید راحت حق

📆Economic calendar Thursday, April 8

Economic calendar  Thursday, April 8

https://s16.picofile.com/file/8429983392/eco8_4_1_%D8%B1%D8%A7%D8%AD%D8%AA_%D8%AD%D9%82.jpg https://s16.picofile.com/file/8429983418/eco8_4_2_%D8%B1%D8%A7%D8%AD%D8%AA_%D8%AD%D9%82.jpg

۱۹ فروردين ۰۰ ، ۰۹:۰۰
حمید راحت حق

Ripple Analysis (XRP) Saturday, April 3

Ripple Analysis (XRP) Saturday, April 3

https://s16.picofile.com/file/8429506934/ripple4_3_%D8%B1%D8%A7%D8%AD%D8%AA_%D8%AD%D9%82.jpg
The price of Ripple Digital Currency is about to break an important resistance level and turn this level into a support. This move could signal the beginning of a strong uptrend.
Ripple prices have been inverted since late November. This pattern is a reversal pattern and reflects price growth in the long run.
This pattern consists of three valleys, one of which is lower than the others and the other valleys include the shoulder part of this pattern.
If the neckline of this pattern breaks at $ 0.63 and the price stabilizes above this level, the next target will be $ 1.09.
Ripple prices are approaching this level but have not yet closed above this resistance.

On the other hand, since January, the number of addresses holding 100,000 to 1 million ripples and 1 million to 10 million of these digital values ​​has increased by 6.17% and 5.85%, respectively. This indicates that investors are optimistic about the future of Ripple.

However, the MVRV index shows a figure of 14%, which means that many of the user accounts that maintain Ripple are not profitable and their investors are reluctant to exit the market any time soon and sell their assets.
The one-month MVRV index also fluctuates in the same range, despite a 45% increase in Ripple prices.

Overall, Ripple is ready to take an uptrend, but the continuation of this trend depends on the strong presence of buyers above the resistance level of $ 0.63.
If the price does not cross the $ 0.63 resistance, then we will see a 16% drop in the price to the level of 61.8%. Fibonacci correction at $ 0.53. If the sell-off continues, the next target of the 50% Fibonacci level will be $ 0.46. If this support level is broken, the reverse of the reverse head and shoulder pattern will be lost and the ready-to-fall price will increase.

۱۴ فروردين ۰۰ ، ۱۸:۴۲
حمید راحت حق

Check the gold trend Monday, March 8

Check the gold trend Monday, March 8

https://s16.picofile.com/file/8427330700/gold8_3_%D8%B1%D8%A7%D8%AD%D8%AA_%D8%AD%D9%82.jpg
The global ounce price rose 0.57% to $ 1,708 as Monday's trading session in Europe approached. Thus, the price of gold has started to rise from its 9-month low.
Given the RSI indicator reached the sell-off zone and the formation of a Dodge candlestick pattern on Friday, there is a possibility that this corrective trend will continue.
However, the bearish trend line since November 30 at $ 1,760 is a resistance.
Meanwhile, the $ 1,700 level plays the role of the first important support that if the price penetrates below this level, we can expect a fall to the downtrend line formed on August 12 at $ 1,677.
If the $ 1,677 support is broken, the price of gold will fall to the level of $ 1,670 and eventually to $ 1,610.

Technical levels
Last price of the day: $ 1707.8
Daily fluctuations: 9.6
Daytime fluctuations (٪): 0.57
Starting price: $ 1698.2
Trends
20-day moving average: $ 1779.02
50-day moving average: $ 1829.15
100-day moving average: $ 1848.59
200-day moving average: $ 1860.11
Levels
Yesterday's highest price: $ 1707.26
Yesterday's lowest price: $ 1687.37
Last week's highest price: $ 1759.98
Last week's lowest price: $ 1687.37
Last month's highest price: $ 1871.9
Last month's lowest price: $ 1717.24
Fibonacci 38.2. Daily: $ 1699.97
Fibonacci 61.8. Daily: $ 1695.16
Pivot S1 Daily: $ 1687.89
Pivot S2 Daily: $ 1677.39
Pivot S3 Daily: $ 1667.4
Pivot R1 Daily: $ 1708.18
Pivot R2 Daily: $ 1718.17
Pivot R3 Daily: $ 1728.57

۱۸ اسفند ۹۹ ، ۱۴:۲۵
حمید راحت حق

An overview of the cryptocurrency market Friday, February 19

An overview of the cryptocurrency market  Friday, February 19

https://bayanbox.ir/view/5477792946733890155/bit%D8%B1%D8%A7%D8%AD%D8%AA-%D8%AD%D9%82.jpg
Over the past 24 hours, we have seen new records being recorded among cryptocurrencies. Bitcoin climbed above $ 52,500 with Atrium and Bainance Coin breaking new records.
A new record for Bitcoin

The currency resumed its uptrend after Bitcoin fell to $ 46,000 on Monday. As reported in the early days of this week, BTC entered the $ 50,000 channel for the first time and has not fallen significantly since. In the last 24 hours, Bitcoin reached its last record at $ 52,600 (on Bitstamp), entering the $ 52,000 area, and continued to rise.

With this record, BTC was only $ 20 billion away from reaching a market value of $ 1 billion. However, after a slight increase yesterday, with the addition of altcoins to this uptrend, bitcoin dominance has once again decreased to 61%.

New records for other altcoins

As mentioned above, most of the replacement coins in the last 24 hours were in line with the upward trend in the market. Atrium is leading the way with a 6% increase. Binance Quinn also reached above $ 180 with its record breaking again. This asset has increased in price by about 350% since January 27 (February 28).

Polkadot (3%), Cardano (10%), Ripple (4%), Litecoin (6%) and Bitcoin Cash (1.5%) are also among the top 10 currencies in the market today.

The situation has been similarly high among lower market value altcoins. Bancor (40%), Venus (34%), Horizen (33%), PancakeSwap (33%), Phantom (26%) and Polygon (25%) are in the double-digit currency group.

Naturally, this overall price increase also means setting a new record in the total value of the crypto market. The market value of all encrypted assets approached $ 1.6 trillion. The index has risen more than $ 700 billion since mid-January.

۰۱ اسفند ۹۹ ، ۰۲:۲۶
حمید راحت حق

Economic calendar Thursday, February 11

Economic calendar Thursday, February 11

https://bayanbox.ir/view/2646282681375414877/eco11-2%D8%B1%D8%A7%D8%AD%D8%AA-%D8%AD%D9%82.jpg

۲۳ بهمن ۹۹ ، ۱۰:۱۶
حمید راحت حق