صفحه اصلی تقویم اقتصادی تحلیل رمزارزها (Cryptocurrency) تحلیل طلا (Gold) تحلیل فارکس (Forex) ارتباط با من درباره من
forex gold :: سایت تحلیل بورس، فارکس و ارز دیجیتال حمید راحت حق| Rahathagh.ir

اخبار و تحلیل نموداری و تکنیکالی بازارهای مالی دنیا اعم از بازار بورس داخلی، بازار فارکس، بازار طلا و بازار ارز دیجیتال و رمزارزها و روانشناسی بازار

۱۰ مطلب با کلمه‌ی کلیدی «forex gold» ثبت شده است

Technical analysis of the global gold ounce Saturday, May 8

Analysis of the global gold ounce Saturday, May 8

https://s19.picofile.com/file/8433048834/gold_%D8%AD%D9%85%DB%8C%D8%AF_%D8%B1%D8%A7%D8%AD%D8%AA_%D8%AD%D9%82.jpg

The price of an ounce of global gold is in a good position after hitting a long-term support level and, according to the analysis of the Credit Suisse Institute, will increase to the level of $ 1,853 within the 200-day moving average indicator.

Gold fell above the important $ 1.755 to $ 1.765 level after falling to the support level of $ 1.682 to $ 1.671, near the level of 38.2 ونا Fibonacci Correction of its five-year long-term uptrend.

Currently, the key resistance levels are $ 1.835, $ ​​1.853 and $ 1.871, respectively.
On the other hand, if the price falls below the support level of $ 1,724 to $ 1,721, the possibility of an uptrend is eliminated.

۱۸ ارديبهشت ۰۰ ، ۱۷:۳۸
حمید راحت حق

Weekly analysis of global gold news and ounce prices Sunday, April 25

Weekly analysis of global gold news and ounce prices Sunday, April 25

https://s18.picofile.com/file/8431764700/gold_forex_%D8%B1%D8%A7%D8%AD%D8%AA_%D8%AD%D9%82.jpg

The price of an ounce of world gold started a downward trend yesterday after hitting the price ceiling of $ 1,795, with a fall of 0.3 to the level of $ 1,778.

The most important reason for this decline is the 2% increase in the yield on US Treasury bonds to 1.567%.

Private-sector economic activity in the United States rose significantly in April from a month earlier, according to figures released by IHS Markit. However, part of the report noted that producers were concerned about Inflation is raising prices.

New home sales in the United States rose about 20.7% in March. Analysts, meanwhile, forecast growth of 12.8 percent.
Currently, the US dollar index is on a downward trend in the range of 91 units, and this could prevent further fall in gold prices.

Technical levels

Last price of the day: $ 1781.61
Daytime fluctuations: 2.51-
Daytime fluctuations (٪): 0.14-
Starting price: $ 1784.12

Trends

20-day moving average: $ 1744.16
50-day moving average: $ 1748.33
100-day moving average: $ 1804.1
200-day moving average: $ 1857.18

Levels

Yesterday's highest price: $ 1797.93
Lowest price yesterday: $ 1777.48
Last week's highest price: $ 1783.85
Last week's lowest price: $ 1723.8
Last month's highest price: $ 1759.98
Last month's lowest price: $ 1676.87
Fibonacci 38.2. Daily: $ 1785.29
Fibonacci 61.8. Daily: $ 1790.12

Pivot S1 Daily: $ 1775.09
Pivot S2 Daily: $ 1766.06
Pivot S3 Daily: $ 1754.64
Pivot R1 Daily: $ 1795.54
Pivot R2 Daily: $ 1806.96
Pivot R3 Daily: $ 1815.99

۰۵ ارديبهشت ۰۰ ، ۱۲:۱۶
حمید راحت حق

Gold analysis Wednesday, April 21

Gold analysis Wednesday, April 21

https://s18.picofile.com/file/8431423468/gold_21_4_%D8%B1%D8%A7%D8%AD%D8%AA_%D8%AD%D9%82.jpg

On the global gold ion weekly chart, XAUUSD is still below the resistance line and the long-term moving average at $ 1785. If the weekly ounce chart of the world gold is closed below this resistance, one can expect the price of the ounce gold to fall to the support of $ 1687. In the daily chart of the global gold ounce, we see a situation similar to the situation of the daily chart. If the global gold ounce crosses the $ 1785 resistance level, the next target of the resistance market will be $ 1855. In the four-hour chart of global gold ounces, the short-term market trend is declining and the price of global gold ounces may fall to $ 1760. But the break of the $ 1785 resistance will pave the way for the market to rise to the next resistance at $ 1805.

Trading strategy

The $ 1785 resistance will determine the next direction of the market. The failure of this resistance will change the market trend upwards. But if it can maintain its position, the market will fall to lower support.

۰۱ ارديبهشت ۰۰ ، ۱۴:۱۱
حمید راحت حق

Weekly evaluation of Kitco site Monday, April 5

Weekly evaluation of Kitco site Monday, April 5

https://s16.picofile.com/file/8429691126/kitco5_4_%D8%B1%D8%A7%D8%AD%D8%AA_%D8%AD%D9%82.jpg
At the same time with the formation of the twin floor below $ 1700, optimism about the future price of an ounce of global gold has been strengthened. Last week, the XAUUSD jumped twice below $ 1,700. Although the optimism of market professionals has been relatively strong, the concerns of small investors have not yet been allayed. The latest weekly assessment of Kitco News shows that disagreements between small investors and market professionals have increased. While gold has been able to jump above the monthly price floor and end the week above $ 1,700, some analysts believe that it is not yet possible to talk about a strong uptrend in the market.
This week, 15 Wall Street activists took part in the weekly evaluation of the Kitco site. 73% predict that this week's trend will be an upward ounce of global gold. 13% forecast a downtrend and another 13% expect a trend-free market. Meanwhile, 1,565 Main Street investors took part in an online poll. 41% are in favor of an uptrend, 44% are in favor of a downtrend and 16% are in favor of a trend-free market.

Analysis of market professionals

Colin Cieszynski SIA Wealth Management Senior Market Strategy
"Last week, the world ounce price of gold experienced a significant drop, so it can be said that the recent price increase is just a technical leap. "I do not expect a steady rising rally in the price of an ounce of global gold, and the market is facing many obstacles." He added that he would only be sure of the market's uptrend if the price of a global ounce of gold went above $ 1,780.
Darin Newsom Independent Market Analyst
The activist expects the market to rise in the short term, but he prefers to rely on the uptrend after the defeat of the $ 1756 resistance. According to Newsom, the global ounce of gold is in fierce competition with the US dollar. The long-term trend of the US dollar seems to be upward. The US dollar and the price of an ounce of world gold are inversely related.
Marc Chandler, senior market strategist at Bannockburn Global Forex
According to Chandler, rising inflation could lead investors to gold. In times of inflation, investors use gold to cover the risk of inflation. "The twin floor will only be confirmed if the price crosses the peak between the two floors, meaning that the global ounce price must rise above $ 1,754 to confirm the twin floor signal."

۱۶ فروردين ۰۰ ، ۱۲:۰۱
حمید راحت حق

Gold Analysis Thursday, March 25

Gold Analysis Thursday, March 25

https://s17.picofile.com/file/8428783792/gold_%D8%B1%D8%A7%D8%AD%D8%AA_%D8%AD%D9%82.jpg
The price of the global ounce of gold fluctuated around $ 1,735 at the beginning of Thursday and has not yet managed to cross the $ 5 range. The price is currently fluctuating within the indicator of the 200-hour moving average and is nearing the end of the symmetrical triangle pattern.
Given the low volatility trend of the RSI indicator, one can expect the price to move only if the resistance of $ 1,738 or support of $ 1,725 ​​is broken. On the other hand, the 78.6% Fibonacci level at $ 1,720 and the monthly price ceiling at $ 1,755 play the role of support and resistance levels, respectively.
If the price fails to maintain the corrective trend at the beginning of March and the US dollar index grows, then sellers will be able to control the market for a longer period of time.

Technical levels
Last price of the day: $ 1734.48
Daytime fluctuations: 0.48-
Daytime fluctuations (٪): 0.03-
Starting price: $ 1734.96
Trends
20-day moving average: $ 1726.26
50-day moving average: $ 1787.01
100-day moving average: $ 1826.41
200-day moving average: $ 1860.65
Levels
Yesterday's highest price: $ 1738.48
Yesterday's lowest price: $ 1723.86
Last week's highest price: $ 1755.59
Last week's lowest price: $ 1719.3
Last month's highest price: $ 1871.9
Last month's lowest price: $ 1717.24
Fibonacci 38.2. Daily: $ 1732.9
Fibonacci 61.8. Daily: $ 1729.44
Pivot S1 Daily: $ 1726.39
Pivot S2 Daily: $ 1717.81
Pivot S3 Daily: $ 1711.77
Pivot R1 Daily: $ 1741.01
Pivot R2 Daily: $ 1747.05
Pivot R3 Daily: $ 1755.63

۰۵ فروردين ۰۰ ، ۱۳:۳۴
حمید راحت حق

Check the gold trend Monday, March 8

Check the gold trend Monday, March 8

https://s16.picofile.com/file/8427330700/gold8_3_%D8%B1%D8%A7%D8%AD%D8%AA_%D8%AD%D9%82.jpg
The global ounce price rose 0.57% to $ 1,708 as Monday's trading session in Europe approached. Thus, the price of gold has started to rise from its 9-month low.
Given the RSI indicator reached the sell-off zone and the formation of a Dodge candlestick pattern on Friday, there is a possibility that this corrective trend will continue.
However, the bearish trend line since November 30 at $ 1,760 is a resistance.
Meanwhile, the $ 1,700 level plays the role of the first important support that if the price penetrates below this level, we can expect a fall to the downtrend line formed on August 12 at $ 1,677.
If the $ 1,677 support is broken, the price of gold will fall to the level of $ 1,670 and eventually to $ 1,610.

Technical levels
Last price of the day: $ 1707.8
Daily fluctuations: 9.6
Daytime fluctuations (٪): 0.57
Starting price: $ 1698.2
Trends
20-day moving average: $ 1779.02
50-day moving average: $ 1829.15
100-day moving average: $ 1848.59
200-day moving average: $ 1860.11
Levels
Yesterday's highest price: $ 1707.26
Yesterday's lowest price: $ 1687.37
Last week's highest price: $ 1759.98
Last week's lowest price: $ 1687.37
Last month's highest price: $ 1871.9
Last month's lowest price: $ 1717.24
Fibonacci 38.2. Daily: $ 1699.97
Fibonacci 61.8. Daily: $ 1695.16
Pivot S1 Daily: $ 1687.89
Pivot S2 Daily: $ 1677.39
Pivot S3 Daily: $ 1667.4
Pivot R1 Daily: $ 1708.18
Pivot R2 Daily: $ 1718.17
Pivot R3 Daily: $ 1728.57

۱۸ اسفند ۹۹ ، ۱۴:۲۵
حمید راحت حق

Return of gold ounces from key support

Return of gold ounces from key support

https://bayanbox.ir/view/7270866199690193010/ImageDetail-%D8%B1%D8%A7%D8%AD%D8%AA-%D8%AD%D9%82.jpg

On November 30, 2020, the global ounce of gold, after hitting $ 1764, started moving up to the price of $ 1959.36. Gold traders entered the market around this rate, which resulted in the beginning of a new downtrend. Recently, gold ounce price movements have been restricted between the two downtrend lines. In today's trading, the market is again supported by the price of $ 1708.64 and the price of gold has risen. If the market continues to return positively from $ 1708.6 and the ounce of gold breaks the downtrend line, one can expect the market to move to the rate of $ 1742.21, the moving average of 50 and the resistance of $ 1767.
But if the ounce of gold definitively breaks the 1708.64-1700 range, it could start a new downtrend to support at $ 1675 and then $ 1650.

۱۴ اسفند ۹۹ ، ۲۲:۲۴
حمید راحت حق

Weekly Gold Analysis Sunday, February 21

Weekly Gold Analysis Sunday, February 21

https://bayanbox.ir/view/7394721176202554383/kitco-21-2-%D8%B1%D8%A7%D8%AD%D8%AA-%D8%AD%D9%82.jpg

Fundamental analysis of ounces of global gold

Investors and market professionals are also pessimistic about the future of gold prices after the global ounce price fell to its lowest level in eight months. The rise in US Treasury yields has been a major factor in lowering the price of an ounce of global gold. Analysts and traders are pessimistic about the future and medium-term trend of the global ounce of gold, while investors' optimism about the future of the gold market has reached its lowest level in several years. Some analysts believe that the price of an ounce of global gold could fall further in the medium term, as rising US Treasury yields could force the Federal Reserve to control the yield curve. Analysts believe that controlling the US yield curve could be to the detriment of the US dollar.
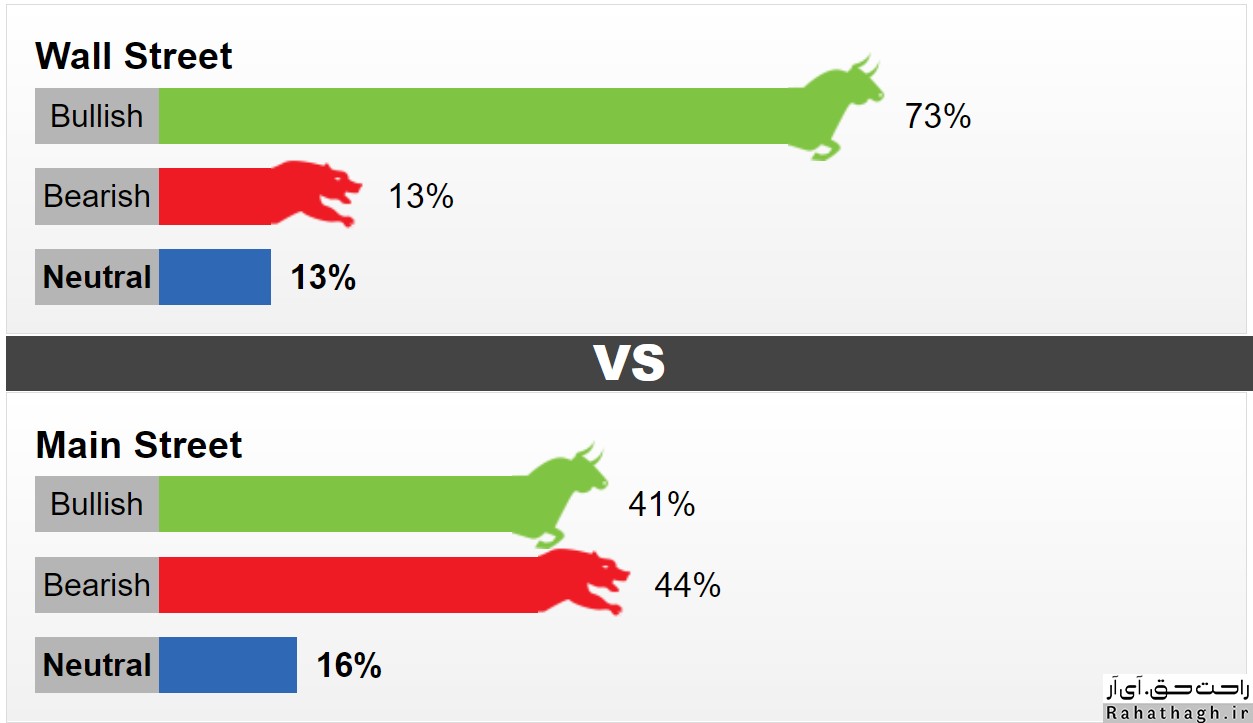
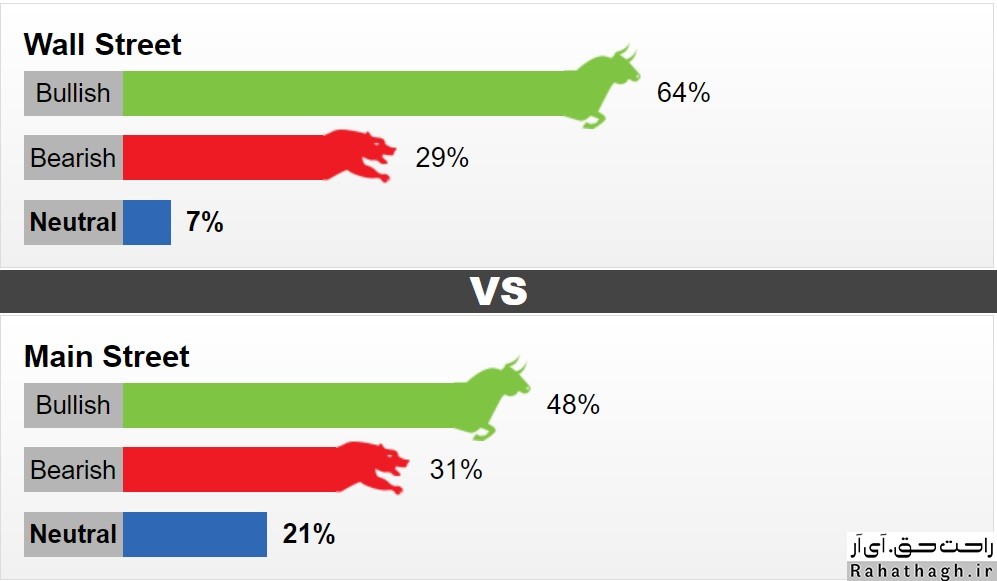
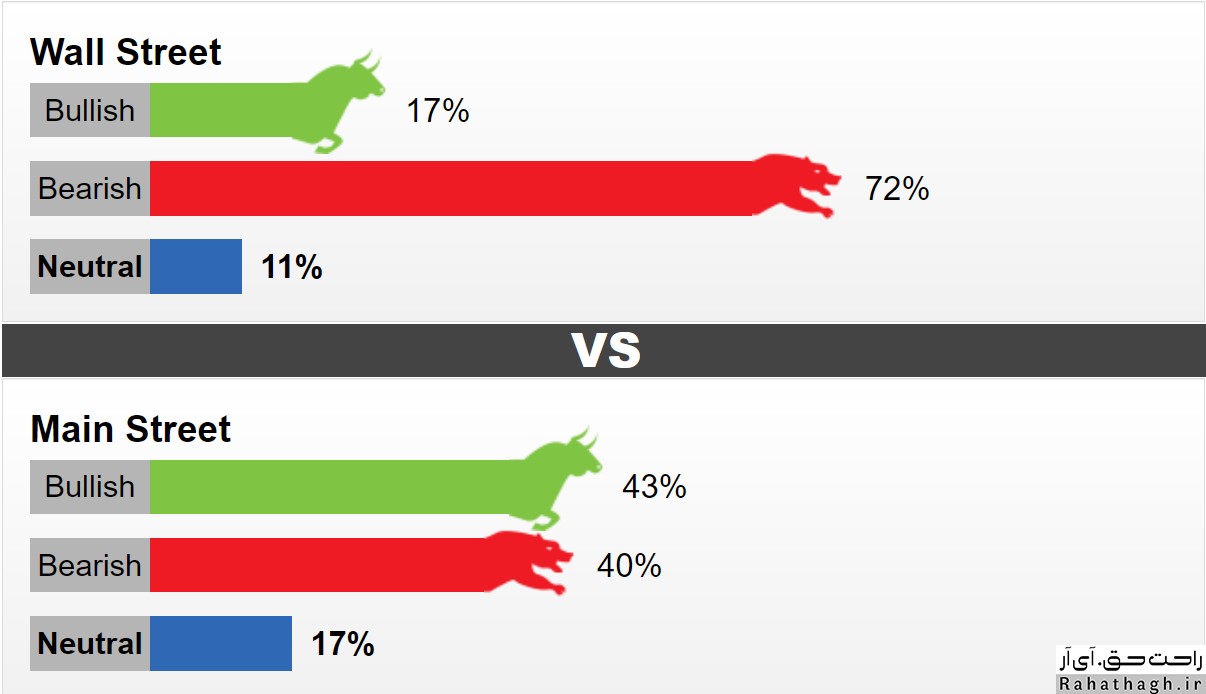
This week, 18 Wall Street activists took part in the weekly Kitco News review. 17% of respondents predict that the global gold ounce trend will be bullish. 72% predict that the market trend will be downward. Meanwhile, another 11 percent predict that the market will be trendless. Meanwhile, 1,292 Main Street investors took part in the online survey. 43% were in favor of an uptrend, 40% were in favor of a downtrend and 17% were in favor of a trend-free market.
Many analysts believe that the US Treasury bond market is the biggest threat to the gold market. Although inflationary pressures are on the rise, on the other hand, economic growth expectations are strong and therefore offset the effect of inflation expectations. These optimisms about the future of the world economy have led to an increase in US Treasury yields, which will eventually lead to an increase in real interest rates in the US economy. An increase in real interest rates is to the detriment of ounces of global gold, as it increases the opportunity cost of investing in gold.
The views of gold market professionals

Adrian Day, President of Adrian D. Asset Management Company
"The fall in the price of an ounce of world gold has been longer and deeper than I expected. "However, I think the gold market is entering a period in which long-term buyers are likely to either exit the market or refuse to re-enter the market." The professional activist went on to say that the pressure to sell ounces of global gold was too normal, but it should be noted that market price movements do not always proceed with the fundamental situation. Adrian Dee hopes to hit the gold market in the next week or two.
Ole Hansen leads Saxo Bank strategy team
This professional activist is pessimistic about the global gold ounce trend. He said that even if the fundamentals of the global ounce of gold were strong, he was still pessimistic about the future of the global ounce price. "Before the market starts to move upwards, it needs to change. "We are almost certain that inflation will grow faster than previously predicted, and when that happens, real bond yields will be balanced." According to Hansen, although the Federal Reserve is likely to control the yield curve, he believes that the Fed will not act until the rate hike hurts the US stock market.
David Madden Senior Market Strategy at CMC Markets
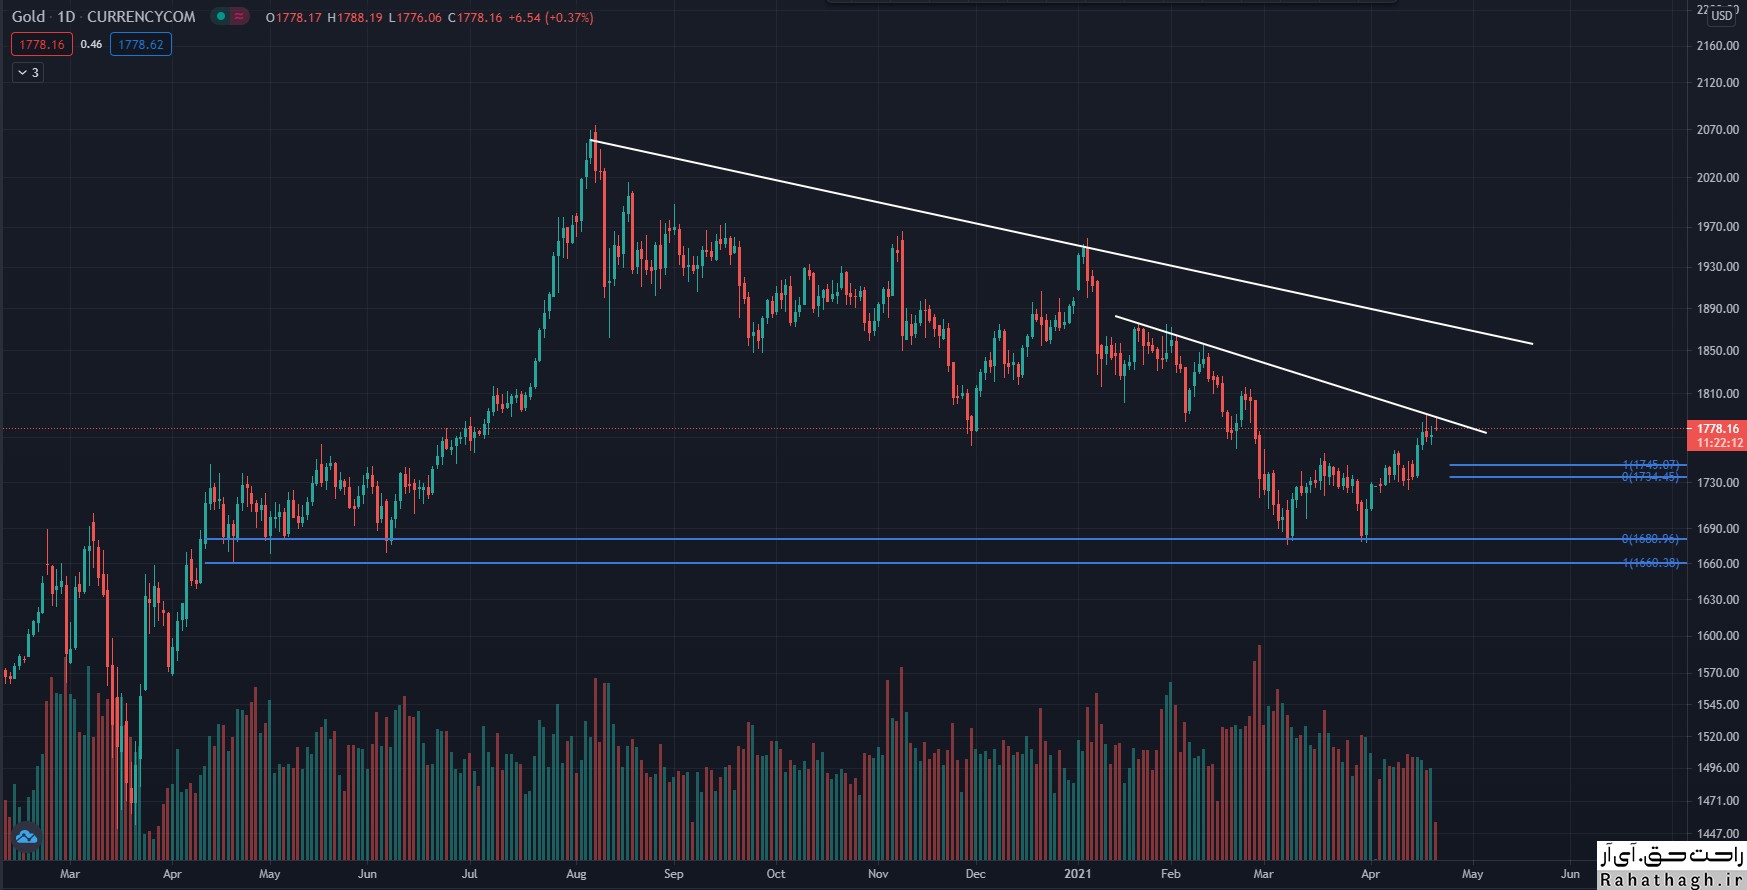
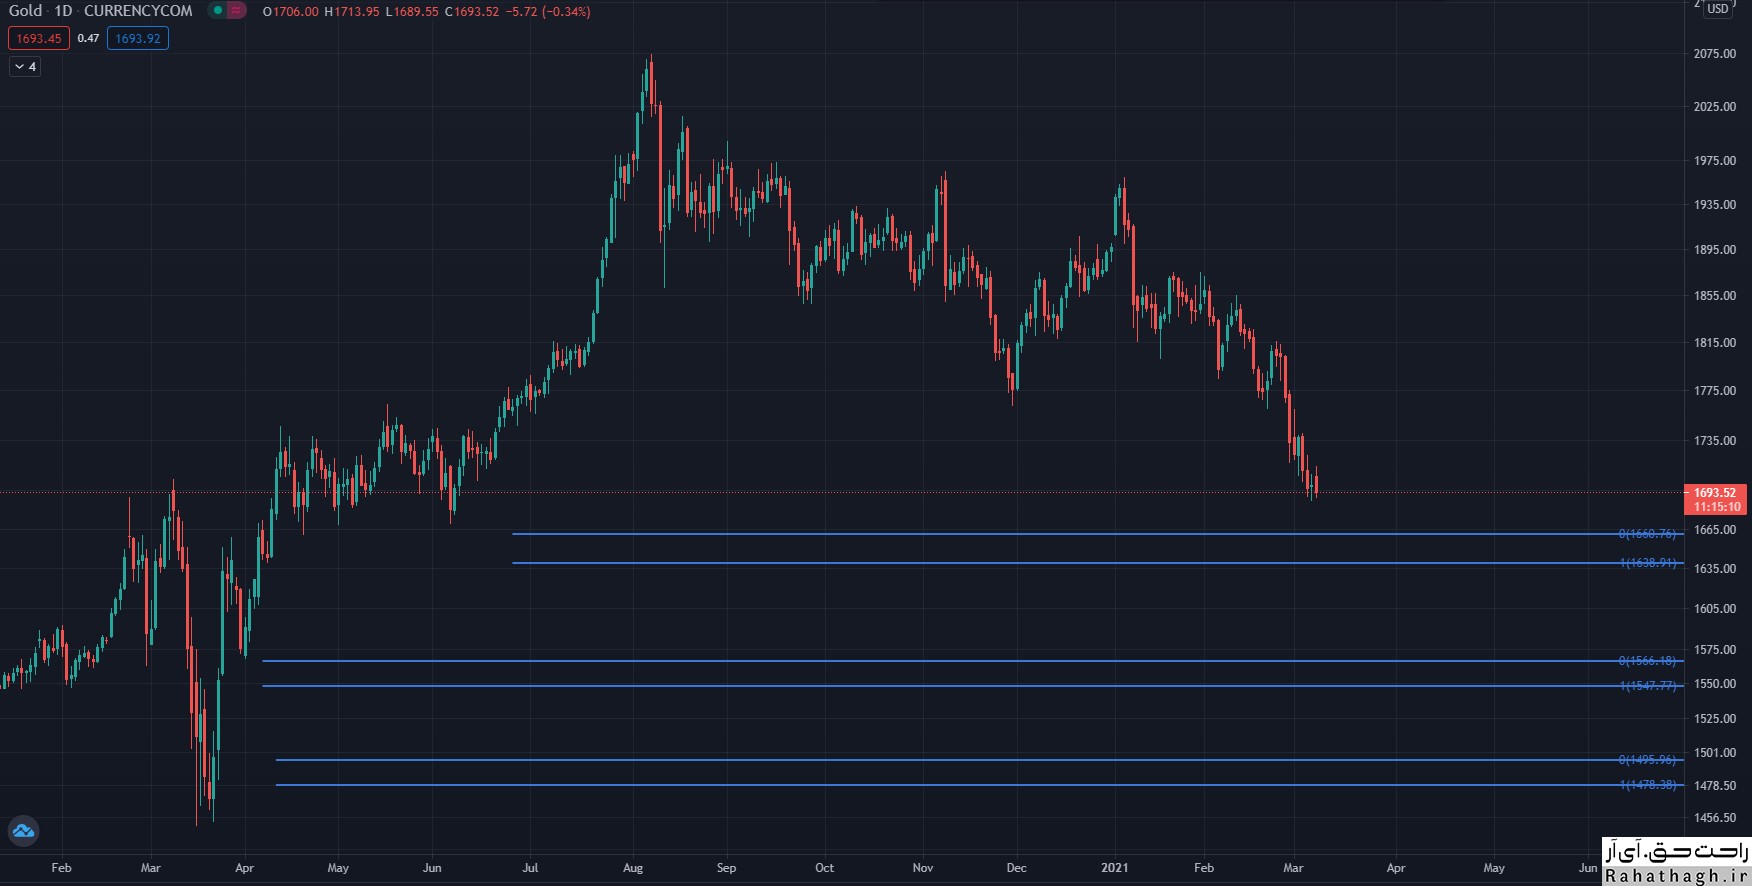
The activist expects the price of an ounce of global gold to fall as the rate of return on Treasury bonds rises. However, he remains optimistic about the medium-term ounce of global gold. "Increasing the yield on US Treasury bonds will draw all attention to a possible rate hike," he said. "While no central bank in the world wants to raise interest rates, there is still the possibility of an upward rally in the global ounce of gold." He added that the global ounce gold market fluctuates between $ 1,700 and $ 1,900. He does not expect the market to rise to $ 2,000, as the global economy shows signs of recovery.
Colin Cieszynski Senior Market Strategy at SIA Asset Management
According to the activist, part of the demand for gold has been lost due to the attractiveness of bitcoin and other digital currencies, especially since the price of bitcoin has risen above $ 50,000.
Marc Chandler is the CEO of Bannockburn Global Forex
The fall of the global gold ounce to $ 1,760 has driven many buyers off the market. One can expect the market to hit the range of $ 1810-1795. Crossing the global ounce price above $ 1820 could improve the technical outlook for the gold ounce. It has recently been rumored that Bitcoin is the gold of the modern world, but I do not agree with this idea. "I think it will take more time to judge."

۰۳ اسفند ۹۹ ، ۱۲:۱۴
حمید راحت حق

Weekly analysis of the global Gold Saturday , February 20

Weekly analysis of the global Gold Saturday , February 2

https://bayanbox.ir/view/4164295542326912606/200728-gold-bar-%D8%B1%D8%A7%D8%AD%D8%AA-%D8%AD%D9%82.jpg
The GOLD price of gold yesterday experienced an upward trend from the lowest level in the last seven months. Gold traded lower at $ 1,760 and rose to $ 1,790 after the official start of trading in the United States.
Gold ended the week at $ 1,780 and fell 2.35% over the past seven days. This is the worst weekly gold performance since July.
After testing the support level of $ 1,765 to $ 1,770, the price of gold was able to start a corrective trend. Stabilizing the price below this level will cause a downward trend.
Similarly, the stabilization of the price above the level of $ 1,790 can be considered a sign of the possibility of an uptrend for gold.
However, the correction in the price of gold seems limited and there is a possibility that the price will fall. Investors' risk appetite has increased as Treasury bond yields have risen. On Friday, the 10-year yield on US Treasury bonds reached a one-year high of 1.35%.

Technical levels
Last price of the day: $ 1783.54
Daily fluctuations: 8.80
Daytime fluctuations (٪): 0.5
Starting price: $ 1774.74
Trends
20-day moving average: $ 1826.92
50-day moving average: $ 1854.34
100-day moving average: $ 1865.24
200-day moving average: $ 1858.94
Levels
Yesterday's highest price: $ 1789.76
Lowest price yesterday: $ 1768.46
Last week's highest price: $ 1855.5
Last week's lowest price: $ 1807.86
Last month's highest price: $ 1959.42
Last month's lowest price: $ 1802.8
Fibonacci 38.2. Daily: $ 178.62
Fibonacci 61.8. Daily: $ 1776.6
Pivot S1 Daily: $ 1765.55
Pivot S2 Daily: $ 1756.35
Pivot S3 Daily: $ 1744.25
Pivot R1 Daily: $ 1786.85
Pivot R2 Daily: $ 1798.95
Pivot R3 Daily: $ 1808.15

۰۲ اسفند ۹۹ ، ۱۵:۳۵
حمید راحت حق

Weekly Gold Analysis Monday, February 7

Weekly Gold Analysis Monday, February 7

https://bayanbox.ir/view/9037470472824552199/gold7-2%D8%B1%D8%A7%D8%AD%D8%AA-%D8%AD%D9%82.jpg

The ounce of global gold in mid-August 2018, in the form of support hit $ 1160 and started a new bullish rally, so that the price of gold rose to $ 2075 over two years. This is a historic price point for gold. The upward movement of gold stopped after hitting the range of 2050-2075 and then we saw the entry of ounces of gold into the downtrend channel, so that the market moved to the moving average of 50.
The ounce of gold was resisted by $ 1875 and the moving average of 20, which resulted in the market moving to an average of 50. An ounce of gold has returned to the upside after each hit. So in this week's trading, if the 50-day moving average and the $ 1800 trend are turned into support, one can expect the market to return to the 20-day moving average, the $ 1875 level and finally the channel ceiling. The failure of the channel resistance can make the presence of gold buyers in the market more colorful.
But if the ounce of gold breaks the $ 1800 trend and the average of $ 50, the downtrend will pave the way around the $ 1700 trend.


Activists and investors in the global gold ounce market are skeptical about the future of the market, according to a weekly assessment by Kitco News. Although the majority of market traders expect the price of an ounce of global gold to rise in the coming weeks, among small investors, supporters of the uptrend are less than 50%.
Meanwhile, the price of an ounce of silver has returned below $ 27 and all growth since the beginning of last week has disappeared. The price of silver has fallen after reaching the highest price of the last eight years. The fall in the price of silver has negatively affected the views and expectations of retail investors. Analysts believe that small investors' pessimism about the silver market has spread to the global ounce gold market. Micro-investors, most influenced by the social network, expected a rapid return to the silver market, and this frustration may spread to the gold market.
This week, 14 Wall Street activists took part in the weekly evaluation of the Kitco site. 64% predict that this week's trend will be an upward ounce of global gold. Another 29% predict that the market trend will be downtrend and another 7% expect the market to be trending or neutral. A total of 1,823 Main Street activists took part in the online poll. 48% are in favor of the uptrend, 31% are in favor of the downtrend and 21% are in favor of the neutral trend.
Kitco's online poll shows that micro-investor pessimism about the global ounce trend has reached its highest level since late November. At that time, the price of an ounce of world gold had fallen below $ 1,800. Last week, professional activists and small investors expected the price of an ounce of global gold to rise. However, the ounce price of global gold fell by almost 2%.


۱۹ بهمن ۹۹ ، ۱۳:۴۶
حمید راحت حق