صفحه اصلی تقویم اقتصادی تحلیل رمزارزها (Cryptocurrency) تحلیل طلا (Gold) تحلیل فارکس (Forex) ارتباط با من درباره من
+راحت حق+ :: سایت تحلیل بورس، فارکس و ارز دیجیتال حمید راحت حق| Rahathagh.ir

اخبار و تحلیل نموداری و تکنیکالی بازارهای مالی دنیا اعم از بازار بورس داخلی، بازار فارکس، بازار طلا و بازار ارز دیجیتال و رمزارزها و روانشناسی بازار

۵ مطلب با کلمه‌ی کلیدی «+راحت حق+» ثبت شده است

Cardano Analysis (ADA) Wednesday, March 10

Cardano Analysis (ADA) Wednesday, March 10

https://s17.picofile.com/file/8427526692/cardano_%D8%B1%D8%A7%D8%AD%D8%AA_%D8%AD%D9%82.jpg
Matt Cardano Digital has taken a low-swing trend after crossing the border of the regular triangle pattern. According to this model, Cardano has a goal of $ 1.56.
According to the IOMAP chart, Cardano is on the rise in the absence of strong resistance. However, the $ 1.15 to $ 1.18 resistance range is particularly important. In this price range, over 2.1 billion Cardanos have been purchased by 38,250 user accounts.
Prices are currently above the level of a significant self-stabilization support. According to the IOMAP chart, about 147,000 accounts have purchased 5.1 billion of these digital currencies in the $ 1.11 to $ 1.15 range.

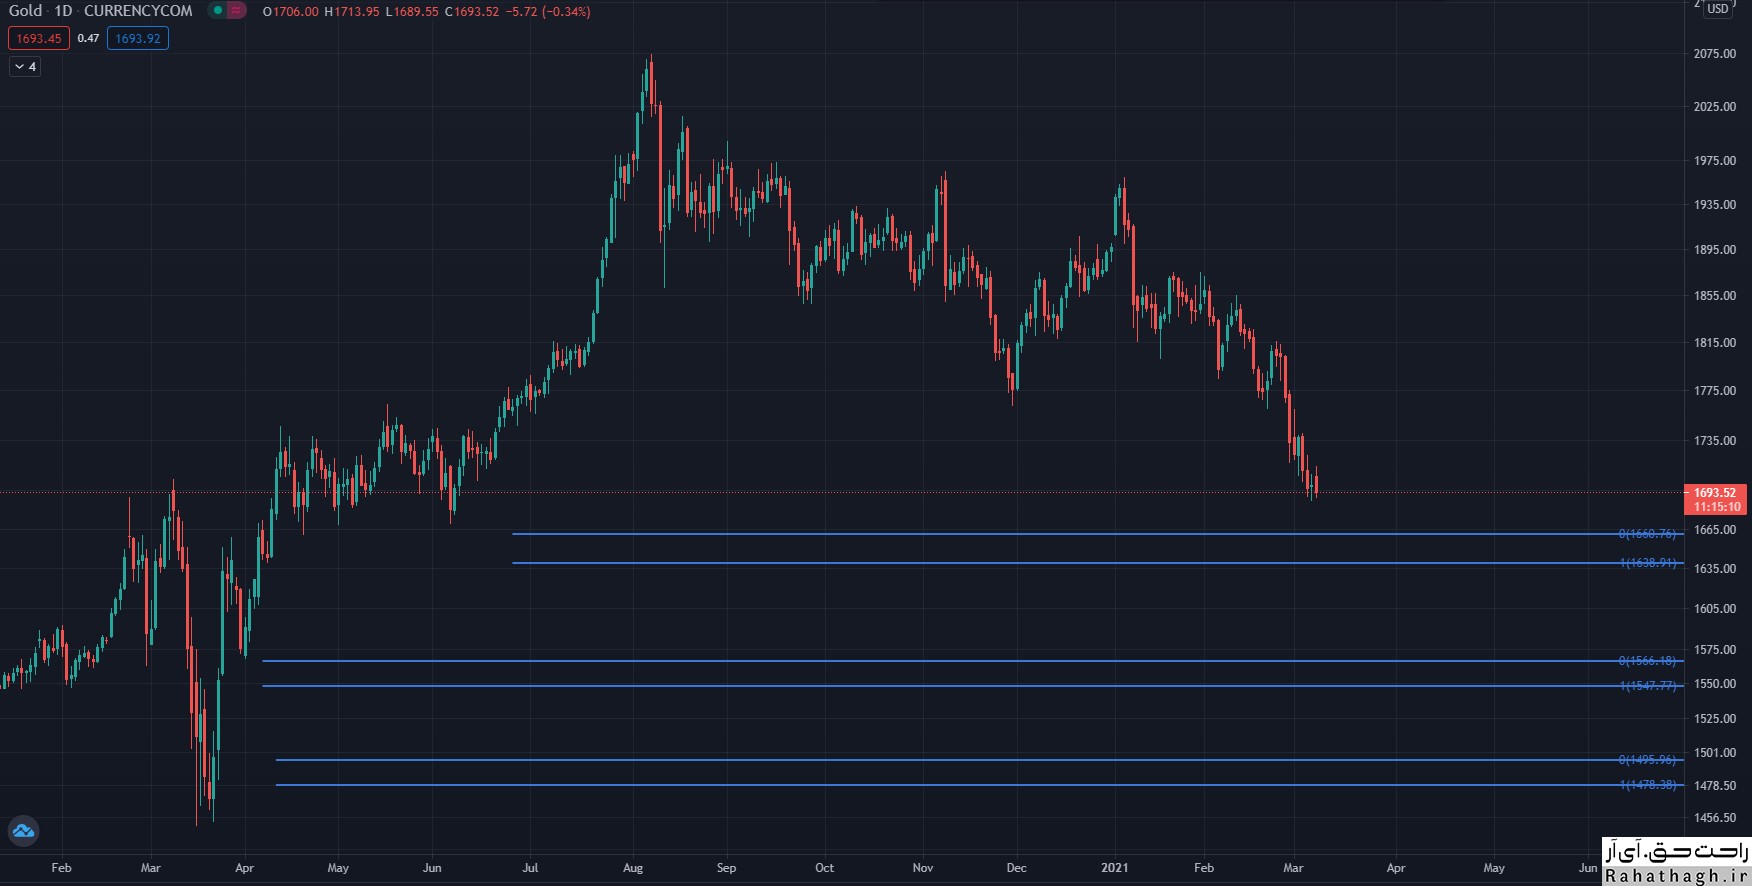
Looking at the four-hour timeframe, we notice the formation of a regular triangle pattern and its breaking. According to this pattern, the price is likely to grow by 34% to $ 1.56. Despite the breaking of this pattern, the uptrend of stability is still not formed. On the other hand, stabilizing the high price of moving average indicators is necessary to form an uptrend.
Similarly, if the MACD indicator is above the signal line, then the $ 1.56 target can be predicted with more confidence.
On the other hand, if the price penetrates below the levels of 50 and 100 moving average indicators in the four-hour time frame, a downward trend is formed and if the price returns to the triangle pattern range, one can expect a further fall in price.

۲۰ اسفند ۹۹ ، ۱۲:۵۲
حمید راحت حق

Check the gold trend Monday, March 8

Check the gold trend Monday, March 8

https://s16.picofile.com/file/8427330700/gold8_3_%D8%B1%D8%A7%D8%AD%D8%AA_%D8%AD%D9%82.jpg
The global ounce price rose 0.57% to $ 1,708 as Monday's trading session in Europe approached. Thus, the price of gold has started to rise from its 9-month low.
Given the RSI indicator reached the sell-off zone and the formation of a Dodge candlestick pattern on Friday, there is a possibility that this corrective trend will continue.
However, the bearish trend line since November 30 at $ 1,760 is a resistance.
Meanwhile, the $ 1,700 level plays the role of the first important support that if the price penetrates below this level, we can expect a fall to the downtrend line formed on August 12 at $ 1,677.
If the $ 1,677 support is broken, the price of gold will fall to the level of $ 1,670 and eventually to $ 1,610.

Technical levels
Last price of the day: $ 1707.8
Daily fluctuations: 9.6
Daytime fluctuations (٪): 0.57
Starting price: $ 1698.2
Trends
20-day moving average: $ 1779.02
50-day moving average: $ 1829.15
100-day moving average: $ 1848.59
200-day moving average: $ 1860.11
Levels
Yesterday's highest price: $ 1707.26
Yesterday's lowest price: $ 1687.37
Last week's highest price: $ 1759.98
Last week's lowest price: $ 1687.37
Last month's highest price: $ 1871.9
Last month's lowest price: $ 1717.24
Fibonacci 38.2. Daily: $ 1699.97
Fibonacci 61.8. Daily: $ 1695.16
Pivot S1 Daily: $ 1687.89
Pivot S2 Daily: $ 1677.39
Pivot S3 Daily: $ 1667.4
Pivot R1 Daily: $ 1708.18
Pivot R2 Daily: $ 1718.17
Pivot R3 Daily: $ 1728.57

۱۸ اسفند ۹۹ ، ۱۴:۲۵
حمید راحت حق

Weekly Analysis: Will USDJPY reach the bottom of the downtrend channel?

Weekly Analysis: Will USDJPY reach the bottom of the downtrend channel?

https://bayanbox.ir/view/5435669464475382024/shut-%D8%B1%D8%A7%D8%AD%D8%AA-%D8%AD%D9%82.jpg
In late 2016, the USDJPY entered the long-term bearish channel after hitting 118.66 and fell to the bottom of the channel at 101.18. Also, from early July 2020 to January 29, the USDJPY entered a medium-term downtrend channel in which the pair moved to a moving average after breaking the channel ceiling. USDJPY is supported by the 105.00 trend rate and has reached the partial resistance of 106.75 after breaking the average of 50.
In this week's trading, if the USDJPY faces buying pressures and crosses the above resistance level of 106.75, the market will move up to the long-term average of 200 at the trend level of 108.00 and then the long-term downtrend channel.

۱۰ اسفند ۹۹ ، ۲۰:۵۲
حمید راحت حق

Ripple proved that the SEC did not warn them about the "securities" of the XRP currency

Ripple proved that the SEC did not warn them about the "securities" of the XRP currency

https://bayanbox.ir/view/4094238435669137943/1434-%D8%B1%D8%A7%D8%AD%D8%AA-%D8%AD%D9%82.jpg
During a pre-trial conference between Ripple and the Securities and Exchange Commission (SEC), Matthew Solomon, who represented Ripple CEO Brad Garlinghouse, claimed that in the countless discussions that took place during the year In 2019, the SEC did not inform exchanges about the status of XRP "securities".

We have found findings that show that in 2019, the SEC had complex discussions with key market players such as exchange offices and apparently did not inform them at the time that the currency XRP is considered as a securities or investment contract. "Once again, as the case progresses, it becomes clear that the XRP currency cannot and will not be considered a security."

Ripple executives want to end the complaint!

Garlinghouse also filed a petition at the previous conference to close the lawsuit.

His lawyer at the conference denied Garlinghouse's involvement in Ripple's sales program. This charge is one of the main parts of the SEC complaint. The lawyer insists that his client did not know that XRP currency could be considered an investment contract.

Another former Ripple CEO, Chris Larsen, is represented by Paul Weiss’s Martin Flumenbaum. He also claimed that his client also requested that the case be closed.

SEC ready to attack Ripple!

Jorge Gerardo Tenreiro, Jon Daniels and several others represent the SEC. They insist that Ripple offered and sold the XRP currency as an investment contract.

The legislature warned federal judge Analisa Torres that it was likely to respond to Ripple's defenses.

In response, Ripple's lawyer, Andrew J. Ceresney, accused the company of trying to prevent the truth from being discovered.

۰۵ اسفند ۹۹ ، ۱۲:۴۵
حمید راحت حق

An overview of the cryptocurrency market , February 3

An overview of the cryptocurrency market today

https://bayanbox.ir/view/4193841125244643952/crypto%D8%B1%D8%A7%D8%AD%D8%AA-%D8%AD%D9%82.jpg
Bitcoin eventually managed to break out of the $ 33,000 to $ 35,000 range and enter the $ 37,000 range. Most replacement coins are still green today.

The price of Bitcoin broke above $ 35,000

After a very volatile week, the price of Bitcoin calmed down somewhat between $ 33,000 and $ 35,000. The cryptocurrency remained in the same range for the next few days until it finally emerged from the consolidation triangle in the last 24 hours.

The first move raised the price of BTC to $ 35,500 (on Bitstamp), while the next move pushed it to a high of around $ 37,000. However, despite the correction in the price of this currency, it still shows a 3% increase.

Technically, the BTC must cross the next resistance lines at $ 37,000, $ 37,700 and $ 38,620 to target the $ 40,000 level.

Conversely, if the asset fails to maintain its uptrend, support levels of $ 34,500, $ 34,000 and $ 33,110 could help.

Altquin Blast

Over the past few days, most of the major altcoins on the market have also been relatively quiet. However, the situation has changed dramatically in the last 24 hours, especially for some of them.

As previously reported, Atrium set a new record in its history. The latest price record for the second largest cryptocurrency on the market is now around $ 1,580.

Ripple also rose 6% to $ 0.38 after its recent dump. Bitcoin Cash (6%), Bainance Coin (2%), Chinlink (3%), Polkadat (7%), Cardano (2.5%) and Light Coin (12%) also rose in price today.

Fantom still has the best performance among the top 100 currencies in the market, reaching $ 0.15 for the second day in a row with 50% growth. UMA (27%), Siacoin (20%), Terra (17%), SwissBorg (13%), Decentraland (13%) and Maker (12%) also follow.

Finally, the total market value has increased by about $ 100 billion since yesterday, reaching $ 1.1 trillion.

۱۵ بهمن ۹۹ ، ۱۵:۴۳
حمید راحت حق