صفحه اصلی تقویم اقتصادی تحلیل رمزارزها (Cryptocurrency) تحلیل طلا (Gold) تحلیل فارکس (Forex) ارتباط با من درباره من
بررسی gold :: سایت تحلیل بورس، فارکس و ارز دیجیتال حمید راحت حق| Rahathagh.ir

اخبار و تحلیل نموداری و تکنیکالی بازارهای مالی دنیا اعم از بازار بورس داخلی، بازار فارکس، بازار طلا و بازار ارز دیجیتال و رمزارزها و روانشناسی بازار

۴ مطلب با کلمه‌ی کلیدی «بررسی gold» ثبت شده است

Weekly evaluation of Kitco site Monday, April 5

Weekly evaluation of Kitco site Monday, April 5

https://s16.picofile.com/file/8429691126/kitco5_4_%D8%B1%D8%A7%D8%AD%D8%AA_%D8%AD%D9%82.jpg
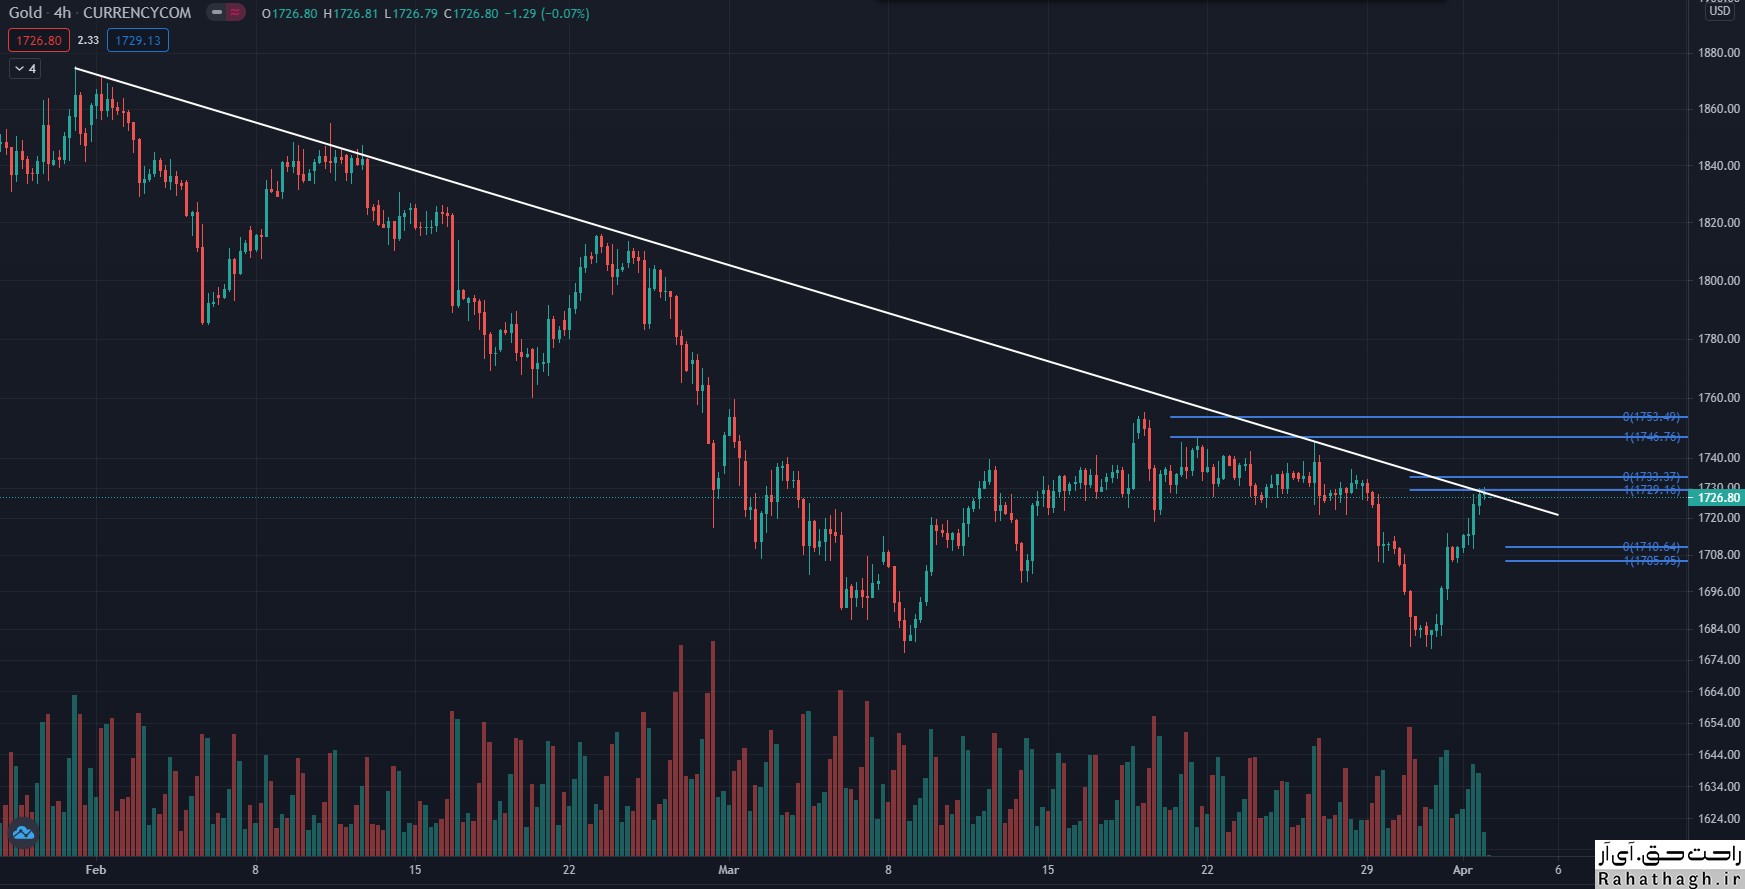
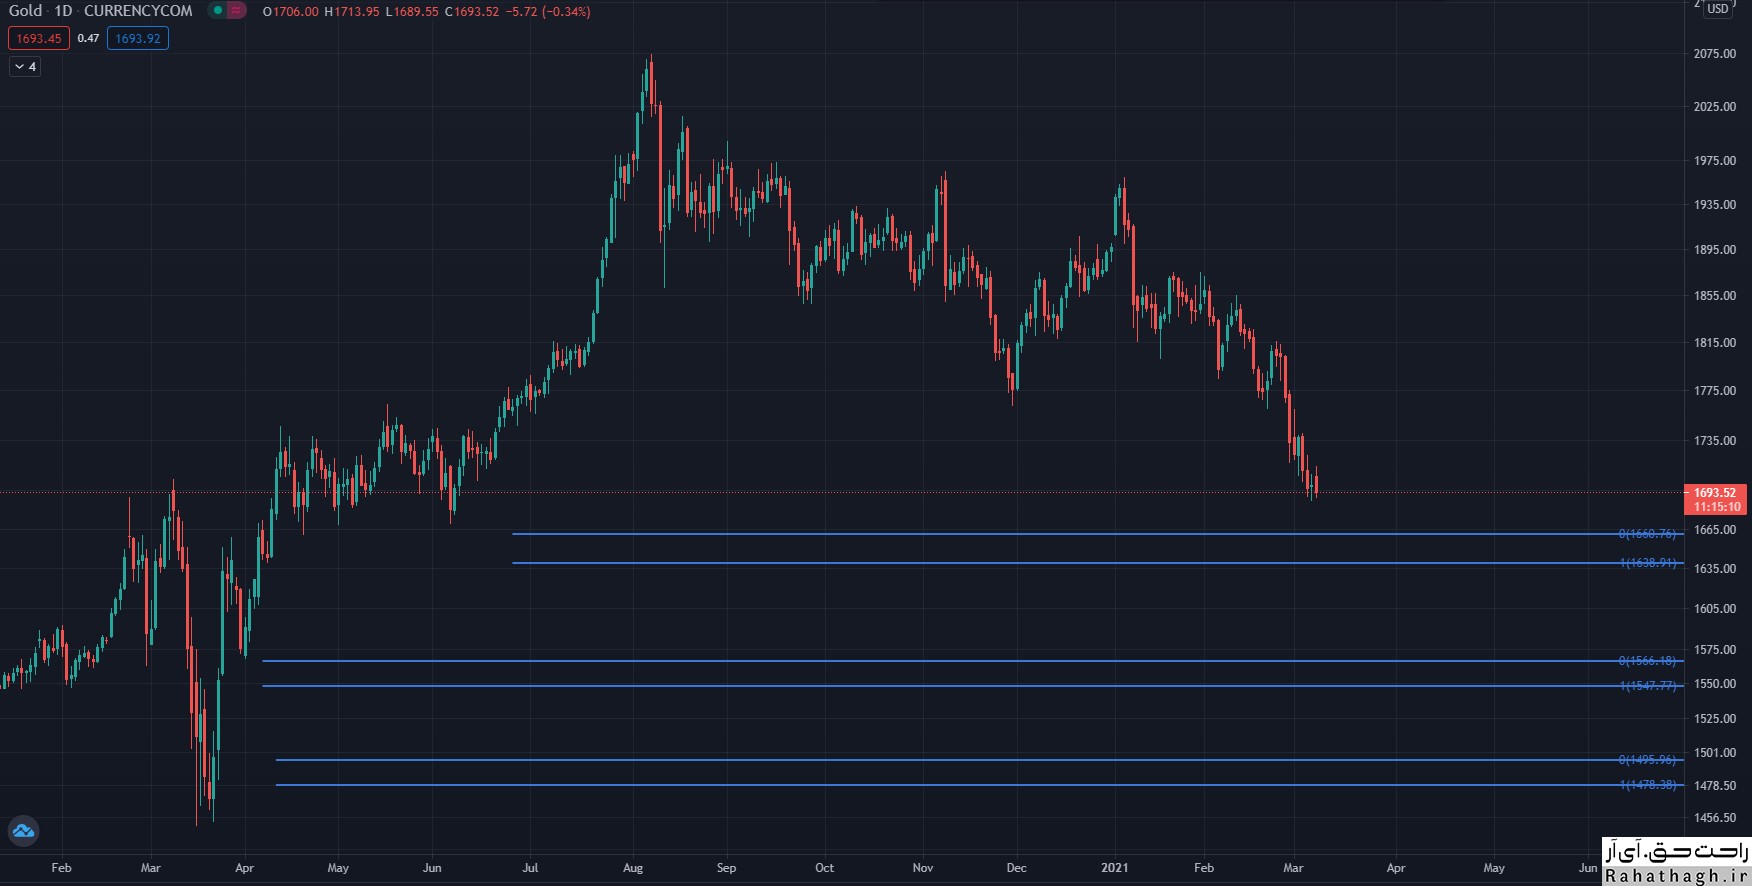
At the same time with the formation of the twin floor below $ 1700, optimism about the future price of an ounce of global gold has been strengthened. Last week, the XAUUSD jumped twice below $ 1,700. Although the optimism of market professionals has been relatively strong, the concerns of small investors have not yet been allayed. The latest weekly assessment of Kitco News shows that disagreements between small investors and market professionals have increased. While gold has been able to jump above the monthly price floor and end the week above $ 1,700, some analysts believe that it is not yet possible to talk about a strong uptrend in the market.
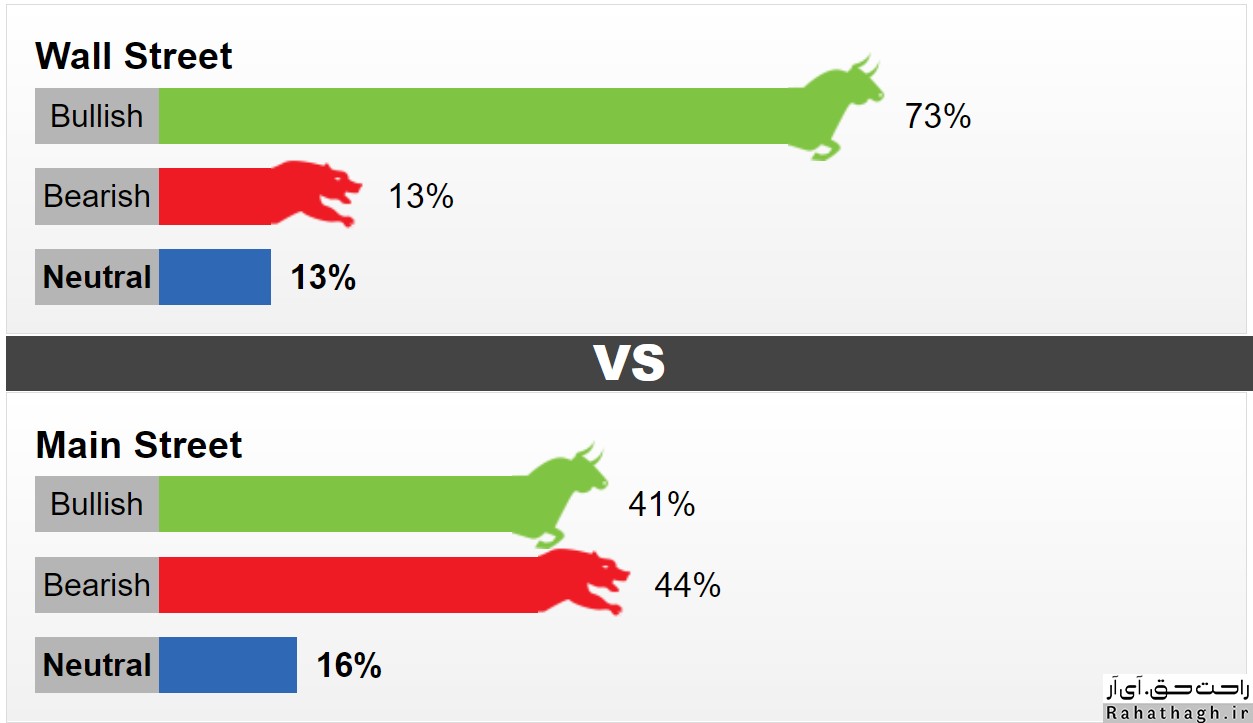
This week, 15 Wall Street activists took part in the weekly evaluation of the Kitco site. 73% predict that this week's trend will be an upward ounce of global gold. 13% forecast a downtrend and another 13% expect a trend-free market. Meanwhile, 1,565 Main Street investors took part in an online poll. 41% are in favor of an uptrend, 44% are in favor of a downtrend and 16% are in favor of a trend-free market.

Analysis of market professionals

Colin Cieszynski SIA Wealth Management Senior Market Strategy
"Last week, the world ounce price of gold experienced a significant drop, so it can be said that the recent price increase is just a technical leap. "I do not expect a steady rising rally in the price of an ounce of global gold, and the market is facing many obstacles." He added that he would only be sure of the market's uptrend if the price of a global ounce of gold went above $ 1,780.
Darin Newsom Independent Market Analyst
The activist expects the market to rise in the short term, but he prefers to rely on the uptrend after the defeat of the $ 1756 resistance. According to Newsom, the global ounce of gold is in fierce competition with the US dollar. The long-term trend of the US dollar seems to be upward. The US dollar and the price of an ounce of world gold are inversely related.
Marc Chandler, senior market strategist at Bannockburn Global Forex
According to Chandler, rising inflation could lead investors to gold. In times of inflation, investors use gold to cover the risk of inflation. "The twin floor will only be confirmed if the price crosses the peak between the two floors, meaning that the global ounce price must rise above $ 1,754 to confirm the twin floor signal."

۱۶ فروردين ۰۰ ، ۱۲:۰۱
حمید راحت حق

Weekly Gold Analysis Saturday, April 3

Weekly Gold Analysis Saturday, April 3

https://s17.picofile.com/file/8429459934/gold_4_3_%D8%B1%D8%A7%D8%AD%D8%AA_%D8%AD%D9%82.jpg
The price of gold has been on the rise despite the growth of employment in the United States. In March, the United States, the world's largest economy, created 916,000 jobs. If inflation continues, will the Fed raise interest rates and reduce the attractiveness of gold for investment? The answer to this question is complicated! But first, gold must be examined technically.
According to the TCI indicator, a significant support level is formed at $ 1,738. This level is the intersection of the middle band of the Bollinger Band indicator in a four-hour time frame with levels of 23.6% weekly Fibonacci and 61.8% monthly Fibonacci.
If this support level is broken, the next target will be the level of $ 1,708. In this range, the 100-hour moving average indicator and the weekly S2 pivot hit a level of 38.2% Fibonacci monthly.

On the other hand, the first resistance level is formed at $ 1,732 (the intersection of the upper band of the Bollinger Band indicator and the level of 38.2% Fibonacci weekly).
If this resistance level is broken, the next target will be the $ 1,747 level. This resistance is formed at the intersection of the daily P2 R2 and the weekly R1.

۱۴ فروردين ۰۰ ، ۱۱:۰۴
حمید راحت حق

Check the gold trend Monday, March 8

Check the gold trend Monday, March 8

https://s16.picofile.com/file/8427330700/gold8_3_%D8%B1%D8%A7%D8%AD%D8%AA_%D8%AD%D9%82.jpg
The global ounce price rose 0.57% to $ 1,708 as Monday's trading session in Europe approached. Thus, the price of gold has started to rise from its 9-month low.
Given the RSI indicator reached the sell-off zone and the formation of a Dodge candlestick pattern on Friday, there is a possibility that this corrective trend will continue.
However, the bearish trend line since November 30 at $ 1,760 is a resistance.
Meanwhile, the $ 1,700 level plays the role of the first important support that if the price penetrates below this level, we can expect a fall to the downtrend line formed on August 12 at $ 1,677.
If the $ 1,677 support is broken, the price of gold will fall to the level of $ 1,670 and eventually to $ 1,610.

Technical levels
Last price of the day: $ 1707.8
Daily fluctuations: 9.6
Daytime fluctuations (٪): 0.57
Starting price: $ 1698.2
Trends
20-day moving average: $ 1779.02
50-day moving average: $ 1829.15
100-day moving average: $ 1848.59
200-day moving average: $ 1860.11
Levels
Yesterday's highest price: $ 1707.26
Yesterday's lowest price: $ 1687.37
Last week's highest price: $ 1759.98
Last week's lowest price: $ 1687.37
Last month's highest price: $ 1871.9
Last month's lowest price: $ 1717.24
Fibonacci 38.2. Daily: $ 1699.97
Fibonacci 61.8. Daily: $ 1695.16
Pivot S1 Daily: $ 1687.89
Pivot S2 Daily: $ 1677.39
Pivot S3 Daily: $ 1667.4
Pivot R1 Daily: $ 1708.18
Pivot R2 Daily: $ 1718.17
Pivot R3 Daily: $ 1728.57

۱۸ اسفند ۹۹ ، ۱۴:۲۵
حمید راحت حق

Technical analysis of the global gold ounce Tuesday, March 2

Technical analysis of the global gold ounce Tuesday, March 2

https://bayanbox.ir/view/6752005902692352902/%D8%B1%D8%A7%D8%AD%D8%AA-%D8%AD%D9%82-gold.jpg
The price of an ounce of global gold on Tuesday continued its downward trend for the fourth consecutive day after the increase in demand and the growth of the US dollar index.
The price of gold is currently affected by the trend of the dollar index and the rate of return of treasury bonds in the absence of important economic news.
Due to the four-hour time frame, the price of gold is breaking the downside channel. If a four-hour candle closes below the support level of the trend line at $ 1,712, we can expect the price to fall to the bottom of 2020, ie $ 1,671.
If this support level is not broken, the price will rise to the level of the moving average indicator 21 in the four-hour time frame, ie $ 1,755.

۱۲ اسفند ۹۹ ، ۲۳:۱۵
حمید راحت حق