صفحه اصلی تقویم اقتصادی تحلیل رمزارزها (Cryptocurrency) تحلیل طلا (Gold) تحلیل فارکس (Forex) ارتباط با من درباره من
RAHAT{HAGH} :: سایت تحلیل بورس، فارکس و ارز دیجیتال حمید راحت حق| Rahathagh.ir

اخبار و تحلیل نموداری و تکنیکالی بازارهای مالی دنیا اعم از بازار بورس داخلی، بازار فارکس، بازار طلا و بازار ارز دیجیتال و رمزارزها و روانشناسی بازار

۱۱ مطلب با کلمه‌ی کلیدی «RAHAT{HAGH}» ثبت شده است

Gold analysis Wednesday, April 21

Gold analysis Wednesday, April 21

https://s18.picofile.com/file/8431423468/gold_21_4_%D8%B1%D8%A7%D8%AD%D8%AA_%D8%AD%D9%82.jpg

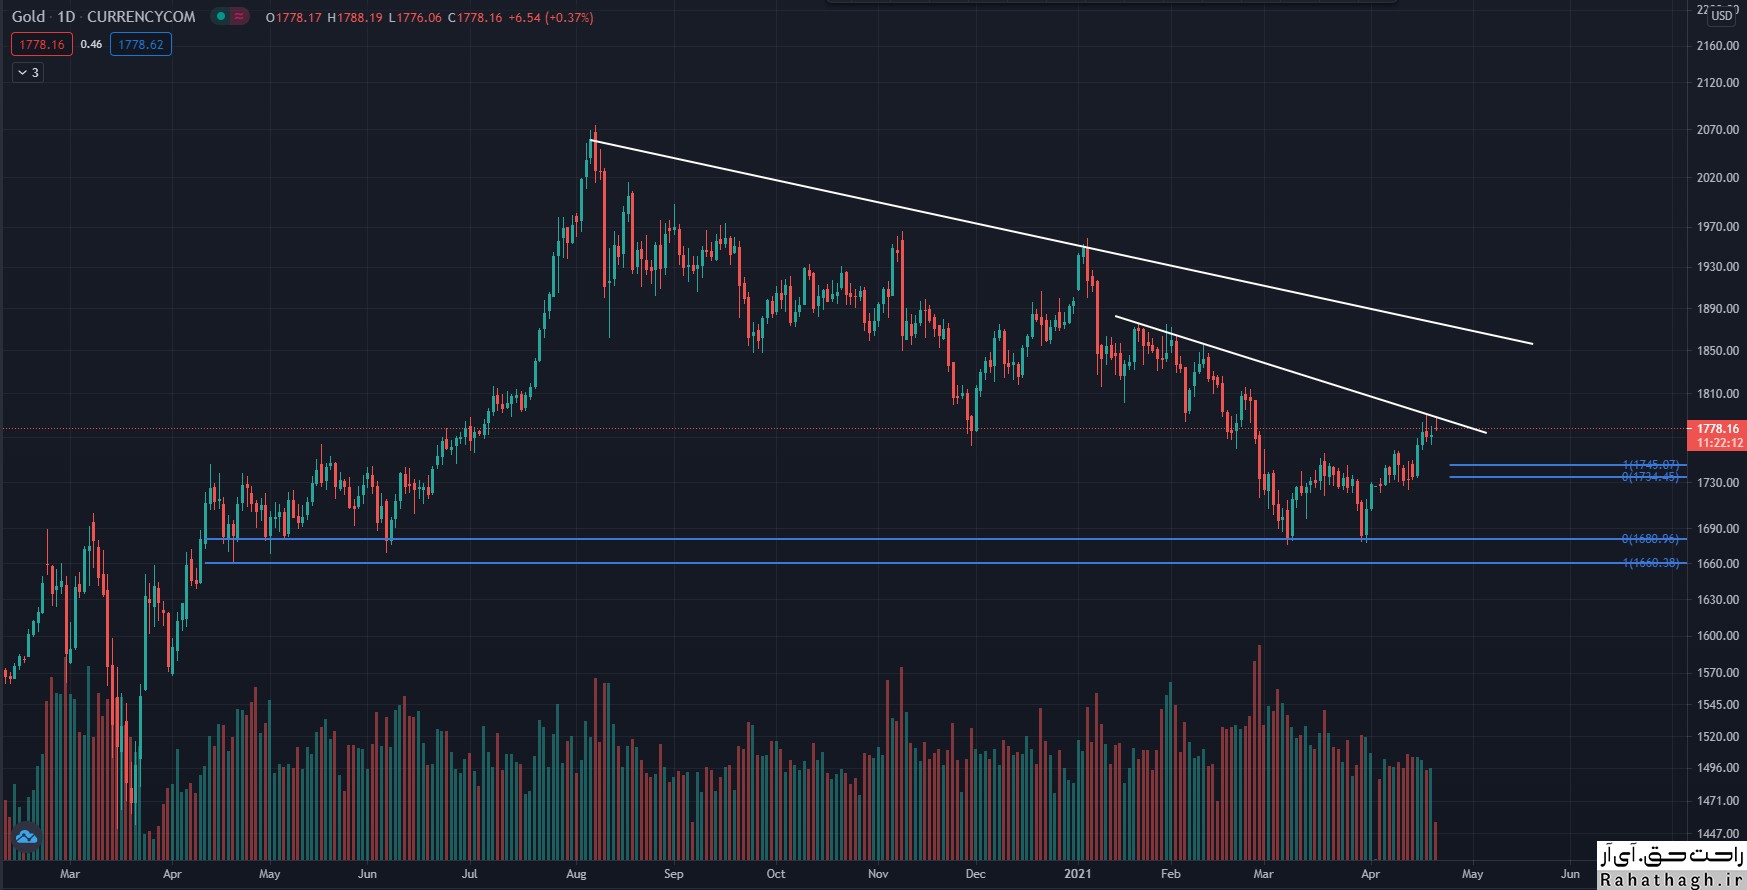
On the global gold ion weekly chart, XAUUSD is still below the resistance line and the long-term moving average at $ 1785. If the weekly ounce chart of the world gold is closed below this resistance, one can expect the price of the ounce gold to fall to the support of $ 1687. In the daily chart of the global gold ounce, we see a situation similar to the situation of the daily chart. If the global gold ounce crosses the $ 1785 resistance level, the next target of the resistance market will be $ 1855. In the four-hour chart of global gold ounces, the short-term market trend is declining and the price of global gold ounces may fall to $ 1760. But the break of the $ 1785 resistance will pave the way for the market to rise to the next resistance at $ 1805.

Trading strategy

The $ 1785 resistance will determine the next direction of the market. The failure of this resistance will change the market trend upwards. But if it can maintain its position, the market will fall to lower support.

۰۱ ارديبهشت ۰۰ ، ۱۴:۱۱
حمید راحت حق

An overview of today's cryptocurrency market Sunday, April 11

An overview of today's cryptocurrency market Sunday, April 11

https://uupload.ir/files/e4k1_crypto-11-4-%D8%B1%D8%A7%D8%AD%D8%AA-%D8%AD%D9%82.jpg

Bitcoin drops back below $ 60,000

After three weeks of waiting, Bitcoin finally reached the price level of more than $ 60,000 yesterday. In addition, the currency moved upwards and reached the price level of $ 61,200.

However, the situation has changed since then. Just when everyone was very happy with the trend, Bitcoin started to retreat again.

In the following hours, Bitcoin lost about $ 2,000 and reached a lower price level of $ 58,300 at (Bitstamp Exchange) and was able to return to above 60 before falling to its current level of $ 59,500. , Reach $ 000.

 Technical indicators show that $ 60,000 is the first major resistance level against the rise of Bitcoin, which could not close the daily candle above yesterday. If the Bitcoin is bullish, it will have to cross the next resistance level of $ 61,170. This price level is the same as the peak price of March, which is $ 61,780. The price could continue to decline if the Bitcoin goes below the support levels of $ 59,070, $ 58,355 and $ 57,695.

Ripple jump to higher levels; XLM among the top 10 currencies

The Altcoin market also had a pleasant trend since Saturday. Atrium was able to reach the highest price level of $ 2200 with the highest price in all time. However, the second largest digital currency at the time fell slightly more than 2% to just over $ 2,100.

Baines Quinn (BNB) also set a new record at $ 485, but calmed down to $ 475. Nevertheless, Binance Quinn has grown by more than 40% over the past week.

Polkadot (-5%), Cardano (-3%), Uniswap (-4%), and Chainlink (-3%) also moved again in the 24-hour timeframe.

Meanwhile, LightQueen rose 10% to $ 250 and Stellar rose 25% to $ 0.61. Also, XLM currency in the market has replaced LINK currency in the list of top 10 currencies in the market.

Ripple performed better than all the larger altcoins. The blockchain-based payment processor won another legal battle against the SEC because Judge Net. Sarah Netburn stopped the commission from trying to access the personal financial records of Ripple executives.

Ripple was able to rise about 40% in the next few hours, hitting a three-year high of $ 1.4.

We saw an increase in digital currencies including Elrond (15%), Reserve Rights (13%), Zcash (10%), IOTA (10%), and NEM (10%).

Despite some corrections in currencies such as Dent (-16%), Holo (-15%), KuCoin Token (-15%), Pundi X (-15%) and others, the market value of cryptocurrencies is over 2 trillion The dollar remained.

۲۲ فروردين ۰۰ ، ۱۷:۴۱
حمید راحت حق

Ripple Analysis (XRP) Saturday, April 3

Ripple Analysis (XRP) Saturday, April 3

https://s16.picofile.com/file/8429506934/ripple4_3_%D8%B1%D8%A7%D8%AD%D8%AA_%D8%AD%D9%82.jpg
The price of Ripple Digital Currency is about to break an important resistance level and turn this level into a support. This move could signal the beginning of a strong uptrend.
Ripple prices have been inverted since late November. This pattern is a reversal pattern and reflects price growth in the long run.
This pattern consists of three valleys, one of which is lower than the others and the other valleys include the shoulder part of this pattern.
If the neckline of this pattern breaks at $ 0.63 and the price stabilizes above this level, the next target will be $ 1.09.
Ripple prices are approaching this level but have not yet closed above this resistance.

On the other hand, since January, the number of addresses holding 100,000 to 1 million ripples and 1 million to 10 million of these digital values ​​has increased by 6.17% and 5.85%, respectively. This indicates that investors are optimistic about the future of Ripple.

However, the MVRV index shows a figure of 14%, which means that many of the user accounts that maintain Ripple are not profitable and their investors are reluctant to exit the market any time soon and sell their assets.
The one-month MVRV index also fluctuates in the same range, despite a 45% increase in Ripple prices.

Overall, Ripple is ready to take an uptrend, but the continuation of this trend depends on the strong presence of buyers above the resistance level of $ 0.63.
If the price does not cross the $ 0.63 resistance, then we will see a 16% drop in the price to the level of 61.8%. Fibonacci correction at $ 0.53. If the sell-off continues, the next target of the 50% Fibonacci level will be $ 0.46. If this support level is broken, the reverse of the reverse head and shoulder pattern will be lost and the ready-to-fall price will increase.

۱۴ فروردين ۰۰ ، ۱۸:۴۲
حمید راحت حق

Economic calendar Thursday, April 1

Economic calendar   Thursday, April 1

https://s17.picofile.com/file/8429298084/eco1_4_1_%D8%B1%D8%A7%D8%AD%D8%AA_%D8%AD%D9%82.jpg https://s16.picofile.com/file/8429298092/eco1_4_2_%D8%B1%D8%A7%D8%AD%D8%AA_%D8%AD%D9%82.jpg https://s17.picofile.com/file/8429298118/eco1_4_3_%D8%B1%D8%A7%D8%AD%D8%AA_%D8%AD%D9%82.jpg https://s16.picofile.com/file/8429298126/eco1_4_4_%D8%B1%D8%A7%D8%AD%D8%AA_%D8%AD%D9%82.jpg

۱۲ فروردين ۰۰ ، ۰۹:۰۰
حمید راحت حق

Economic calendar Friday, March 26

Economic calendar  Friday, March 26

https://s17.picofile.com/file/8428784234/eco26_3_1_%D8%B1%D8%A7%D8%AD%D8%AA_%D8%AD%D9%82.jpg https://s16.picofile.com/file/8428784242/eco26_3_2_%D8%B1%D8%A7%D8%AD%D8%AA_%D8%AD%D9%82.jpg

۰۶ فروردين ۰۰ ، ۰۹:۰۰
حمید راحت حق

Weekly Gold Analysis at Kitco Tuesday, March 16

Weekly Gold Analysis at Kitco Tuesday, March 16

https://s17.picofile.com/file/8428125700/gold16_3_%D8%B1%D8%A7%D8%AD%D8%AA_%D8%AD%D9%82.jpg
According to Kitco News, expectations of market participants appear to be changing, and pessimism about the future of the global ounce gold price has eased. The price of an ounce of global gold was able to maintain its position above $ 1,700. Some analysts believe that the XAUUSD market has formed a short-term price floor. As gold prices return from a 10-week low, the optimism of small investors has been boosted by the rise in gold prices. However, market professionals are still pessimistic about the future. This ambiguity has been created in the expectations and desires of micro-investors and professional activists after the rise in crude oil prices and the approval of the US government's financial and support package. Many analysts have said that the US government's financial support package will support the global ounce price of gold in the long run. Others, however, expect the US government fiscal package to drive strong stock market growth and Treasury yields (to the detriment of the gold market).
This week, 16 Wall Street activists took part in the weekly evaluation of the Kitco site. 38% predict that the global gold ounce trend will be upward this week. 31% predict that the price of an ounce of global gold will fall. Another 31% expect a trend-free or neutral market. 1611 Main Street investors also took part in an online poll. 62% were in favor of the uptrend, 23% were in favor of the downtrend and 15% were in favor of the market without trend or neutral. Not only are a significant number of small investors optimistic about the medium-term trend in global ounces of gold, but the number of pollsters has reached its highest level in a month.

The views of gold market professionals

Adrian Day, President of Adrian D. Capital Management Company
This professional activist is pessimistic about this week's trend of global gold. He expects prices to fall. However, he predicts that the market is at a price floor and a possible price drop will be the last price drop in the market. "We can expect further price declines from current levels, but prices will continue to rise again (meaning prices will not continue to fall). "But even if the price goes down, I will not be a seller." He went on to say that by injecting high liquidity into the world financial system, being a gold seller is a dangerous job.
Adam Button leads Forexlive.com Currency Strategy Team
This professional activist is also optimistic about the global gold ounce trend. According to him, maintaining support at $ 1680 is a good sign for the upward trend of gold ounces. "The market has learned to cope with high rates of return. "This week's meeting of the US Federal Reserve is also unlikely to change monetary policy."
Colin Cieszynski Senior Market Strategy at SIA Capital Management
The activist believes that the rapid growth of the US economy will make it difficult to raise the price of an ounce of global gold. "I doubt the Federal Reserve will downplay the rapid rise in inflation or try to stop the dollar from appreciating and the rate of return," he said. "I do not think the Federal Reserve, like the European Central Bank, is ready to intervene in the market."

۲۶ اسفند ۹۹ ، ۰۹:۳۵
حمید راحت حق

Return of gold ounces from key support

Return of gold ounces from key support

https://bayanbox.ir/view/7270866199690193010/ImageDetail-%D8%B1%D8%A7%D8%AD%D8%AA-%D8%AD%D9%82.jpg

On November 30, 2020, the global ounce of gold, after hitting $ 1764, started moving up to the price of $ 1959.36. Gold traders entered the market around this rate, which resulted in the beginning of a new downtrend. Recently, gold ounce price movements have been restricted between the two downtrend lines. In today's trading, the market is again supported by the price of $ 1708.64 and the price of gold has risen. If the market continues to return positively from $ 1708.6 and the ounce of gold breaks the downtrend line, one can expect the market to move to the rate of $ 1742.21, the moving average of 50 and the resistance of $ 1767.
But if the ounce of gold definitively breaks the 1708.64-1700 range, it could start a new downtrend to support at $ 1675 and then $ 1650.

۱۴ اسفند ۹۹ ، ۲۲:۲۴
حمید راحت حق

An overview of the cryptocurrency market Wednesday, February 24

An overview of the cryptocurrency market Wednesday, February 24

https://bayanbox.ir/view/1744900899927495239/crypto24-2-%D8%B1%D8%A7%D8%AD%D8%AA-%D8%AD%D9%82.jpg

After another volatile day, BTC was able to recover some of its lost value today and trade at $ 50,000. Most alternative coins have also breathed a sigh of relief, and the value of the cryptocurrency market has risen by more than $ 130 billion.

Bitcoin once again touched $ 50,000

It can be said with confidence that BTC is having better days than in the last 96 hours. The cryptocurrency recently set a new record at $ 58,400, but the bears did not allow the price to rise further, pushing Bitcoin to more than $ 13,000, hitting $ 45,000.

Yesterday, the market's top cryptocurrency was initially close to $ 50,000, but adverse price movements pushed the asset back to $ 47,000.

Since then, BTC has improved somewhat. The price of Bitcoin even reached $ 51,500, but is now trading at around $ 50,400 with a slight decrease.

If Bitcoin can successfully overcome the resistance of $ 50,000, then it will face significant resistance at $ 51,500 and $ 52,000. If the price falls again, levels of $ 48,000, $ 47,000 and $ 44,750 could help the currency.

Altcoins trying to recover the price

In the latest market corrections, most replacement coins fell even more than BTC. Atrium fell below $ 1,400 from its $ 2040 record. However, ETH did not fall below its record price floor and is now trading at around $ 1650.

Binance Coin The Binance Coin also fell sharply to around $ 200 but has since risen to $ 270. Polkadat (1.5%) and China Link (2%) have also turned green in the last 24 hours.

In contrast, Ripple (-7%), Light Coin (5%) and Bitcoin Cash (-5%) are still losing value.

Stacks (31%), THORChain (25%), Phantom (25%), UNUS SED LEO (22%), Solana (-17%), Compound (15%), Terra (12%), THETA (11%) And Aave (10%) are among the less valuable market currencies that have seen significant growth today.

As a result, the cumulative capital of the cryptocurrency market also returned somewhat from yesterday's low, rising $ 130 billion to $ 1.51 trillion.

۰۶ اسفند ۹۹ ، ۱۵:۵۱
حمید راحت حق

Stellar Analysis (XLM) Thursday, February 18

Stellar Analysis (XLM) Thursday, February 18

https://bayanbox.ir/view/3367066594993881535/stellar-%D8%B1%D8%A7%D8%AD%D8%AA-%D8%AD%D9%82.jpg
The strength of the upward trend in the price of Stellar digital currency has decreased to $ 0.465 after breaking the resistance level in April 2018. After that, the multi-year price ceiling was recorded at $ 0.61, but the market lost control over the buyers.
Currently, buyers are trying to stabilize the price above the level of $ 0.465 in order to reach the highest price level at $ 1.05.
The recent uptrend has made it easier to reach the historic price record of $ 1.05. The price is currently fluctuating in the range of $ 0.5 and is about 125% away from its record.

On the other hand, the MACD indicator, which is used to determine the entry and exit points, predicts the continuation of the uptrend. The significant distance between the MACD line and the signal line, as well as the fact that the MACD line is higher than the signal line, show us that the price trend is positive.

The RSI indicator also shows a negative price divergence in the four-hour time frame.

This divergence indicates the possibility of price correction. Breaking support levels of $ 0.5 and $ 0.465 are needed to form this correction and a downtrend.

۳۰ بهمن ۹۹ ، ۱۳:۲۳
حمید راحت حق

Economic calendar Tuesday, February 16

Economic calendar Tuesday, February 16

https://bayanbox.ir/view/885959915979691345/eco16-2-%D8%B1%D8%A7%D8%AD%D8%AA-%D8%AD%D9%82.jpg

۲۸ بهمن ۹۹ ، ۱۸:۱۱
حمید راحت حق