صفحه اصلی تقویم اقتصادی تحلیل رمزارزها (Cryptocurrency) تحلیل طلا (Gold) تحلیل فارکس (Forex) ارتباط با من درباره من
راحت+حق :: سایت تحلیل بورس، فارکس و ارز دیجیتال حمید راحت حق| Rahathagh.ir

اخبار و تحلیل نموداری و تکنیکالی بازارهای مالی دنیا اعم از بازار بورس داخلی، بازار فارکس، بازار طلا و بازار ارز دیجیتال و رمزارزها و روانشناسی بازار

۹ مطلب با کلمه‌ی کلیدی «راحت+حق» ثبت شده است

GBPUSD trend analysis Monday, June 28

GBPUSD trend analysis Monday, June 28

https://bayanbox.ir/view/7033196844065733983/gbpusd-28-6-%D8%B1%D8%A7%D8%AD%D8%AA-%D8%AD%D9%82.jpg

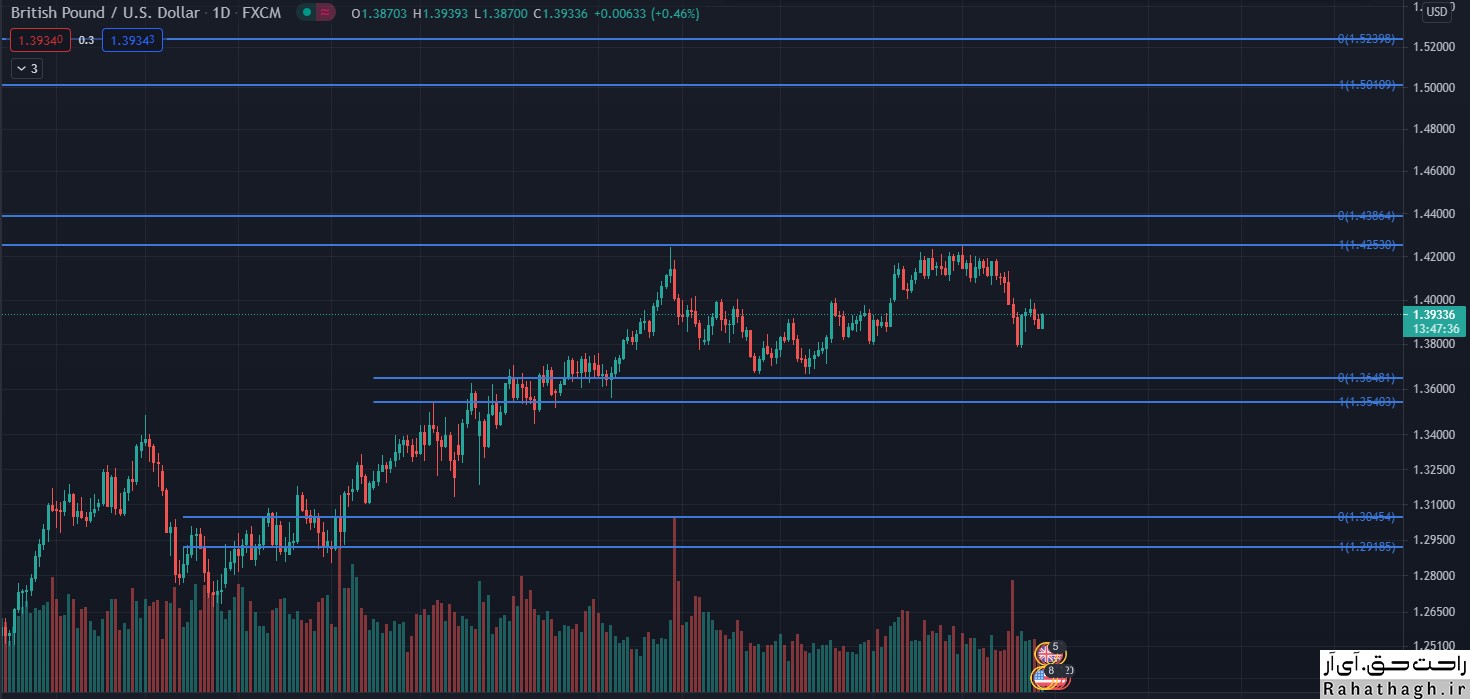
The short-term trend of the British pound against the US dollar is neutral. According to sellers, if the GBPUSD pair falls below the $ 1,3859 support, the downtrend will recover from $ 1,4248 and the market can move to the support of $ 1,3668. From the buyers' point of view, with the break of the $ 1.4000 rate, the short-term market trend will rise to the resistance range of 1.4248-1.4240.


Read more ...

GBPUSD trend analysis Friday, June 25

GBPUSD Wednesday, February 24


۰۷ تیر ۰۰ ، ۱۱:۴۷
حمید راحت حق

Successful {implementation} of the first smart contract on [Alonzo] Cardano

Successful implementation of the first smart contract on Alonzo Cardano

https://bayanbox.ir/view/8368634955701179590/Alonzo-Cardano.jpg According to the June 11 development update, the first smart contract on Alonzo, Cardano Public Network, has been successfully completed.

As reported by U.Today, smart contracts are expected to be fully operational by September.

Currently, the development team is in the middle of the "Alonzo Blue" stage. The program is focused on creating command line interfaces (CLIs) for writing "Hello World" style smart contracts.

As soon as the partners and pioneers can create the basic scripts, Cardano will be ready to move to Alonzo White. According to Nigel Hemsley, Head of Delivery and IOHK Projects, they must successfully prove that they can "send, validate and execute in the supply chain."

During that step, all Plutus components, including the application backend code, will be introduced.

Altlabs, Eleks, Mlabs, Obsidian and other partners are currently working on applications such as cryptocurrency exchanges, liquidity and stock pools, NFTs and exchanges.

When all stock pool operators and Plutus pioneers can join, this public network will be completely public during the "Alonzo Purple" phase.

۲۲ خرداد ۰۰ ، ۱۲:۴۶
حمید راحت حق

Ripple [won] another significant victory over the US Securities and Exchange Commission

Ripple won another significant victory over the US Securities and Exchange Commission

https://bayanbox.ir/view/373481771299463964/Ripple-XRP-Lawsuit.jpg

Judge Sarah Netburn rejected the SEC's offer to obtain any legal advice documents that Ripple had requested or received regarding the legal status of the XRP release.

The Securities and Exchange Commission sought to find out whether they had received any advice on the legal status of XRP as a securities review by reviewing Ripple Legal Advice documents. On the other hand, Ripple claims that these documents are protected under the legal right of the client-lawyer and was able to prevent the access of the Stock Exchange and Securities Commission to these documents.
The Exchange Commission believes that clarifying whether Ripple was aware of the legal status of the XRP release could help the process of pursuing this case.

۱۰ خرداد ۰۰ ، ۲۰:۴۵
حمید راحت حق

Weekly Gold Analysis at Kitco Tuesday, March 16

Weekly Gold Analysis at Kitco Tuesday, March 16

https://s17.picofile.com/file/8428125700/gold16_3_%D8%B1%D8%A7%D8%AD%D8%AA_%D8%AD%D9%82.jpg
According to Kitco News, expectations of market participants appear to be changing, and pessimism about the future of the global ounce gold price has eased. The price of an ounce of global gold was able to maintain its position above $ 1,700. Some analysts believe that the XAUUSD market has formed a short-term price floor. As gold prices return from a 10-week low, the optimism of small investors has been boosted by the rise in gold prices. However, market professionals are still pessimistic about the future. This ambiguity has been created in the expectations and desires of micro-investors and professional activists after the rise in crude oil prices and the approval of the US government's financial and support package. Many analysts have said that the US government's financial support package will support the global ounce price of gold in the long run. Others, however, expect the US government fiscal package to drive strong stock market growth and Treasury yields (to the detriment of the gold market).
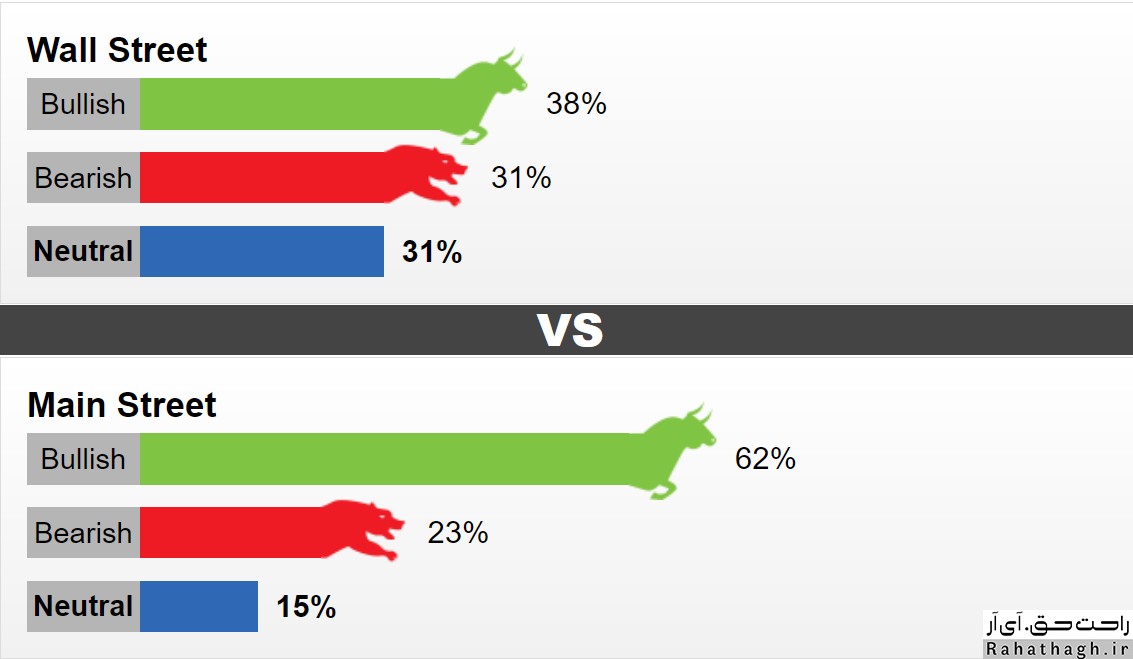
This week, 16 Wall Street activists took part in the weekly evaluation of the Kitco site. 38% predict that the global gold ounce trend will be upward this week. 31% predict that the price of an ounce of global gold will fall. Another 31% expect a trend-free or neutral market. 1611 Main Street investors also took part in an online poll. 62% were in favor of the uptrend, 23% were in favor of the downtrend and 15% were in favor of the market without trend or neutral. Not only are a significant number of small investors optimistic about the medium-term trend in global ounces of gold, but the number of pollsters has reached its highest level in a month.

The views of gold market professionals

Adrian Day, President of Adrian D. Capital Management Company
This professional activist is pessimistic about this week's trend of global gold. He expects prices to fall. However, he predicts that the market is at a price floor and a possible price drop will be the last price drop in the market. "We can expect further price declines from current levels, but prices will continue to rise again (meaning prices will not continue to fall). "But even if the price goes down, I will not be a seller." He went on to say that by injecting high liquidity into the world financial system, being a gold seller is a dangerous job.
Adam Button leads Forexlive.com Currency Strategy Team
This professional activist is also optimistic about the global gold ounce trend. According to him, maintaining support at $ 1680 is a good sign for the upward trend of gold ounces. "The market has learned to cope with high rates of return. "This week's meeting of the US Federal Reserve is also unlikely to change monetary policy."
Colin Cieszynski Senior Market Strategy at SIA Capital Management
The activist believes that the rapid growth of the US economy will make it difficult to raise the price of an ounce of global gold. "I doubt the Federal Reserve will downplay the rapid rise in inflation or try to stop the dollar from appreciating and the rate of return," he said. "I do not think the Federal Reserve, like the European Central Bank, is ready to intervene in the market."

۲۶ اسفند ۹۹ ، ۰۹:۳۵
حمید راحت حق

An overview of the cryptocurrency market Thursday, March 11

An overview of the cryptocurrency market Thursday, March 11

https://s17.picofile.com/file/8427619350/crypto11_3_%D8%B1%D8%A7%D8%AD%D8%AA_%D8%AD%D9%82.jpg
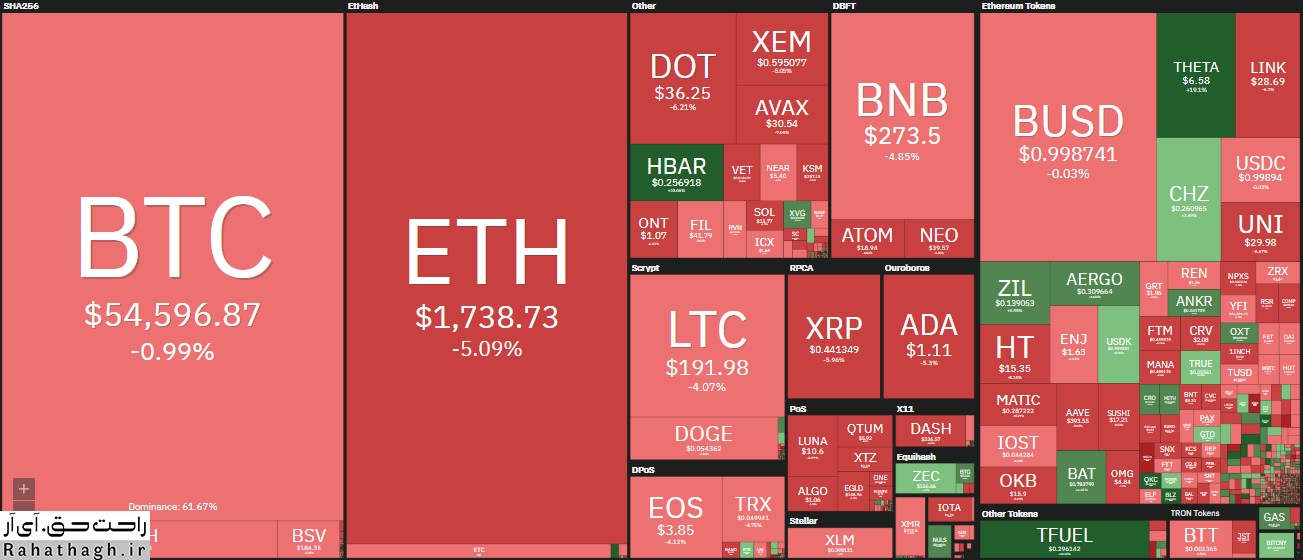
Bitcoin, which was close to the last record set at around $ 1,000, was once again rejected and fell below $ 56,000. However, minor corrections among the Altcoins allowed BTC to regain some of its lost dominance in the market.

Bitcoin was only 2% away from its latest record

Over the past few days, the market's top cryptocurrency has been on the rise after falling to $ 47,000. On the other hand, as organizations became more interested in Bitcoin, its price rose.

The incident hit the $ 50,000 level again, but the cows did not stop at that level, pushing the cryptocurrency to its two-week high of about $ 57,000. According to data released by Bitstamp, the highest daily BTC rate yesterday was around $ 57,400. At this time, the distance between Bitcoin and its highest price level reached about $ 1,000 (1.75%). However, the currency failed to defend this level and reached the current level of $ 55647 following the latest price corrections.

What is remarkable is that the bitcoin market capitalization currently remains well above the $ 1 trillion mark.

Increasing bitcoin dominance

The value of more replacement coins increased with their leader. These developments led Atrium to cross the $ 1,800 mark with a $ 400 increase in one day. However, ETH has fallen slightly since yesterday and is below this sensitive level.

Cardano (-5%), Polkadot (-5%), Ripple (-5.2%), Chainlink (-5.8%) and Uniswap (-5%) have lost some of their value in the last 24 hours.

Binance Coin and Litecoin remain almost unchanged, trading at around $ 275 and $ 195, respectively.

As expected, the situation has been significantly more volatile among low and medium market value altcoins. Meanwhile, Theta Fuel had the best performance with 50% growth. It is followed by Hedera Hashgraph (25%), THETA (19%), Basic Attention Token (15%), Zilliqa (12%) and Bitcoin Gold (11%).

Polygon, on the other hand, fell 10 percent, the biggest drop since yesterday. Avalanche (-9%), Decentraland (-9%), Fantom (-6.5%) and PancakeSwap (-6%) are also in the next ranks.

The relative cessation of large market altcoins has helped bitcoin reassert its dominance in the cryptocurrency market. Thus, the benchmark for comparing the market value of BTC with other altcoins has reached above 61%.

۲۱ اسفند ۹۹ ، ۱۳:۱۸
حمید راحت حق

5cryptocurrencl currencies to watch this week - Monday, March 8

5 cryptocurrency currencies to watch this week

https://bayanbox.ir/view/1535694930976495508/crypto-%D8%B1%D8%A7%D8%AD%D8%AA-%D8%AD%D9%82.jpg  
Bitcoin Fund Indicators (BTC) strengthened after the US Senate passed a $ 1.9 trillion support package bill on March 7. If traders' reaction to the bill is similar to that of April 2020, then cryptocurrencies could see another powerful rally.

This stimulus package increases the focus on the devaluation of the US dollar. According to Peter Brent, these concerns could lead some investors to turn their assets into hard or bitcoin assets instead of keeping them in Fiat currencies.

In addition to investors, a growing number of large companies are deciding to protect their Fiat reserves by buying bitcoins. Following the acquisition of significant amounts of bitcoin by reputable companies such as Microstrategy, Tesla and Square, a Chinese company called Meitu has now announced that it has added $ 40 million in bitcoin and ether to its assets.

If other companies around the world follow these steps and invest part of their treasury reserves in Bitcoin, there will be a kind of imbalance between supply and demand, and as a result, prices will skyrocket.

In the continuation of this discussion, we will examine the charts of the top 5 cryptocurrencies of the week that may resume their upward trend in the short term.

BTC / USD

On March 5 and 6, Bitcoin fell below the 20-day moving average (at $ 48,484), but the long tail on each candlestick indicates that buyers are ready to buy at lower levels. The bulls (buyers) are currently pushing the price towards the upward resistance of $ 52040.

While the 20-day moving average is flat, the Relative Strength Index (RSI) has begun to rise to a high of 58, indicating cows trying to return.

If buyers can push the price above this resistance, the BTC / USD pair may once again touch the $ 58341 record. Breaking this level could start the next stage of the uptrend, which may continue up to $ 71,212.

Contrary to this assumption, if the price falls from this upward resistance and falls below the level of $ 46,313, the price of this pair may fall to the average of the 20-day moving average at the level of $ 42861. This level is likely to act as a strong support.

If the pair returns from this support level, they may spend a few more days in the consolidation phase. But if the bears push the price below $ 41,959.63, traders may be in a hurry to exit, which could lead to a possible change in the bitcoin movement.

In the pair's 4-hour chart, a reverse head and shoulder pattern is formed, which is completed by the breakout and closing of the price at the level of $ 52040. This uptrend has a $ 61075 target.

20-EMA has started to rise and the RSI has reached above the level of 62, which indicates a slight advantage for the cows.

If the price falls below current levels or the resistance overhead breaks the $ 47,000 minister, this uptrend will lose its credibility. Such a move could pave the way for further support at $ 41959.

UNI / USD

After a three-day consolidation period near the $ 29 level, UNI broke the upward resistance yesterday. If the cows can keep the price above $ 29, the outlook for the resumption of the uptrend is strengthened.

Both moving averages have an uptrend, and the RSI is in the buying saturation zone, indicating that the cows are in control. If the UNI / USD pair rises above $ 33, the next price level to look out for is $ 38 and then $ 46.

If the price falls below the current level and falls below the 20-day moving average ($ 25.31), this uptrend will be invalidated. In such a situation, the pair may fall to the level of $ 22 and then the simple 50-day moving average ($ 19.78).

The pair's 4-hour chart shows that the bears are likely to strongly defend the $ 32 upstream resistance. However, if the cows do not allow the price to fall below 20-EMA, it will indicate their strength. A break above the $ 32- $ 33 price range could kick off the next phase of the uptrend.

If the price falls below the 20-EMA, this uptrend will be invalidated. Such a move would indicate that traders are taking action to raise profits when prices rise. After that, the pair could fall to 50-SMA.

THETA / USD

The THETA cryptocurrency is currently in a strong uptrend. Although the price of this Altcoin fell on March 7 (March 17), but the long tail on the candle on March 8 (March 18) shows the purchase at low price levels. Corrections in a strong uptrend usually take one to three days, after which the main trend resumes.


Moving bullish averages and the RSI being close to the buy saturation zone indicate that the cows are in control of the market. If buyers are able to push the price above $ 4.72, the THETA / USD pair may resume its uptrend to $ 5.73.

Conversely, if the price falls from $ 4.50 to $ 4.72 above the resistance area, it is likely to fall to the 20-day moving average ($ 3.58). The return of the price from this support level shows that because the cows continue to buy this currency when the price falls, the positive sentiments of the market remain strong.

If the bear pulls the price below the 20-day moving average, a deeper correction to the 50-day moving average ($ 2.82) is possible. Such a move indicates a momentary weakening of the currency and may delay the resumption of the uptrend.

The 4-hour chart of the THETA / USD pair shows that the 20-EMA is rising and the RSI is in the positive zone. If the bulls can push the price above the downtrend and keep it at the same level, the pair may touch the $ 4.72 level again. The defeat of this resistance can start the next stage of the uptrend.

On the other hand, if the price continues to correct, it will probably find good support in 20-EMA. In this situation, the cows are again trying to bring the price to levels above the downtrend line. However, a break below the 20-EMA could push the price down to $ 3.85.

VET / USD

Vicin is currently limited in the range of $ 0.0345 to $ 0.060774. The price had reached the resistance level during this period, but yesterday's long wick of the candle shows a profit reservation near the level of $ 0.060774.

However, the moving averages have an uptrend, and the RSI is in the positive zone, indicating that the path with the least resistance is an uptrend. If the bulls can move the price above the level of $ 0.060774 and maintain that level, the VET / USD pair can start the next stage of its uptrend.

The first target in this uptrend is $ 0.087048 and if it crosses this level, the pair may reach $ 0.10.

Contrary to this assumption, if the price falls below the current level, the VET / USD pair is likely to fall to the 20-day moving average ($ 0.047). The return of this support shows that the uptrend remains unchanged, but a break below this support may be followed by price movements in a limited range.

 Cows have not yet allowed prices to fall. If the pair returns from the 20-EMA, the cows will once again try to push the price above the resistance level.

If they can keep the price above $ 0.060774, the next stage of the uptrend may begin. However, if the price falls below the 20-EMA, the selling pressure is likely to intensify and the price will fall until further support at the 50-SMA.

LUNA / USD

Over the past few days, the Terra Token (LUNA) has been consolidating in the range of $ 5 to $ 8.50. Both moving averages have an uptrend, and the RSI is located near the buy saturation zone. This fact shows that the path with the least resistance is the ascending path.

On March 5, the cows were able to push the price above this level, but with this price failure, the upward movement did not continue and on March 6, the price of LUNA fell below $ 8.50. This indicates that demand has declined at higher levels.

However, if the cows do not leave the field, they indicate that traders are waiting to buy at lower price levels. In the event of such an event, buyers may try again to start the next phase of the uptrend. If successful, the LUNA / USD pair could approach the $ 12 level.

Long wicks on candlesticks above $ 8.50 indicate a higher profit margin. The cows are also currently trying to defend the 20-EMA. If the price returns from the current level, buyers will try again to resume the uptrend by pushing the price to higher levels of resistance above $ 8.50 to $ 9.

Conversely, if the bears can pull the price below 20-EMA and keep it there, the pair may reach 50-SMA. If the price returns from this level, the LUNA / USD pair is likely to consolidate in the upper half of this range for some time. The price drop below the simple moving average of 50 indicates the fact that the price may be in the range of $ 5 to $ 6.

۱۸ اسفند ۹۹ ، ۱۲:۱۲
حمید راحت حق

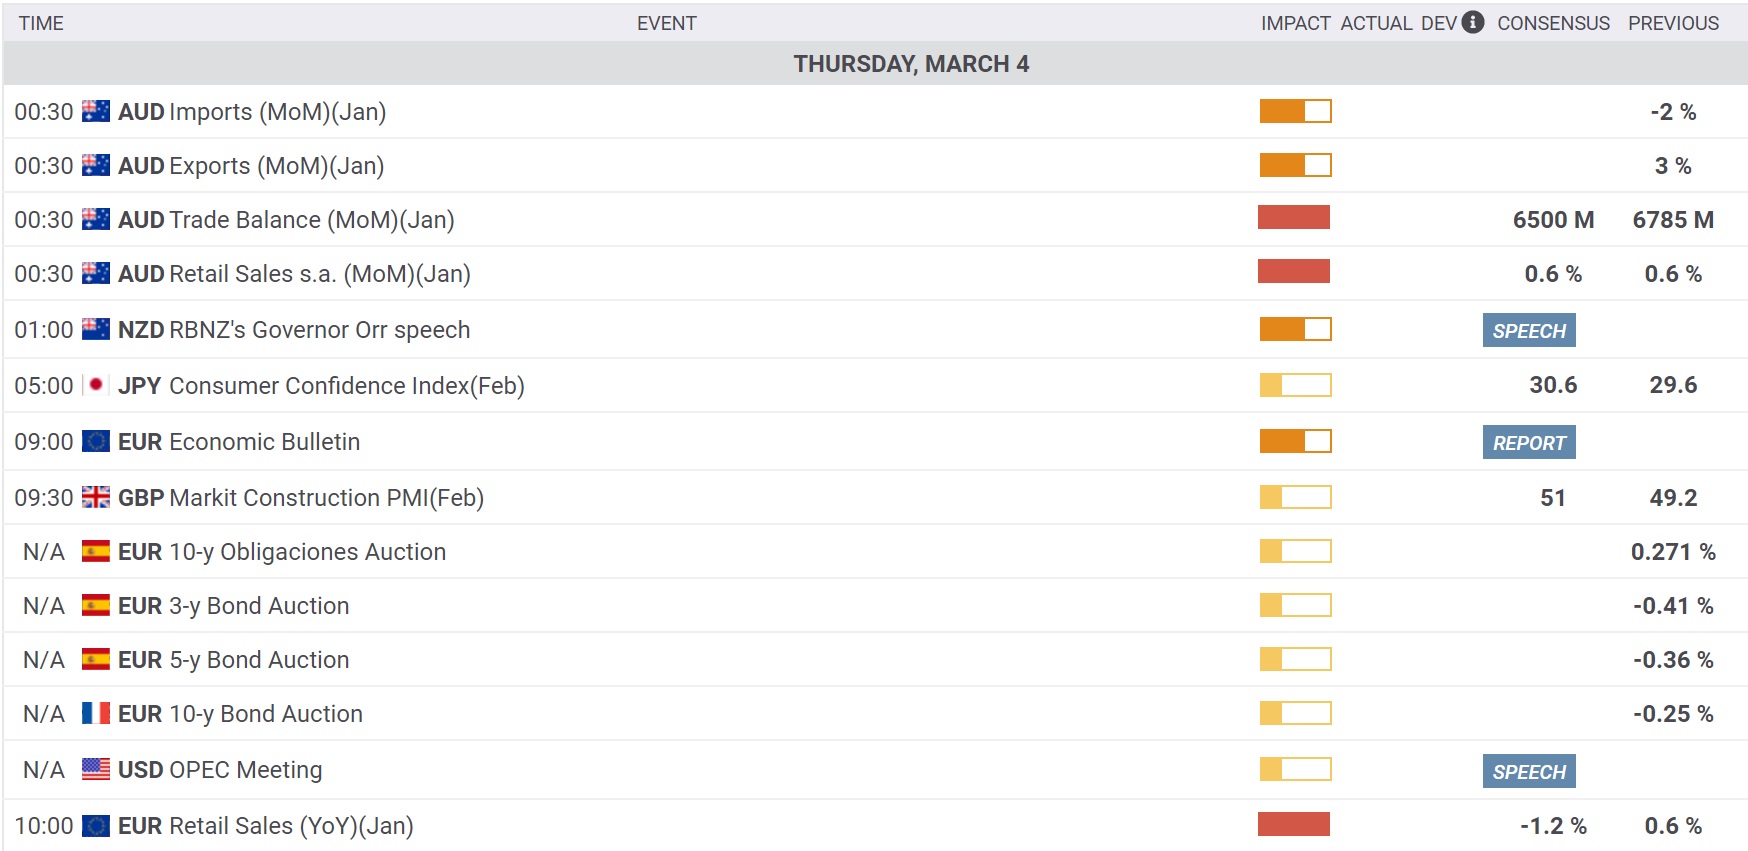
Economic calendar Thursday, March 4

Economic calendar  Thursday, March 4

https://bayanbox.ir/view/5168247233902977683/eco4-3-1-%D8%B1%D8%A7%D8%AD%D8%AA-%D8%AD%D9%82.jpg https://bayanbox.ir/view/5965620064185396343/eco4-3-2-%D8%B1%D8%A7%D8%AD%D8%AA-%D8%AD%D9%82.jpg

۱۴ اسفند ۹۹ ، ۰۹:۰۰
حمید راحت حق

EURUSD Thursday, February 11

EURUSD Thursday, February 11

https://bayanbox.ir/view/8279395159996211685/Everything-about-EUR-USD-%D8%B1%D8%A7%D8%AD%D8%AA-%D8%AD%D9%82.jpg
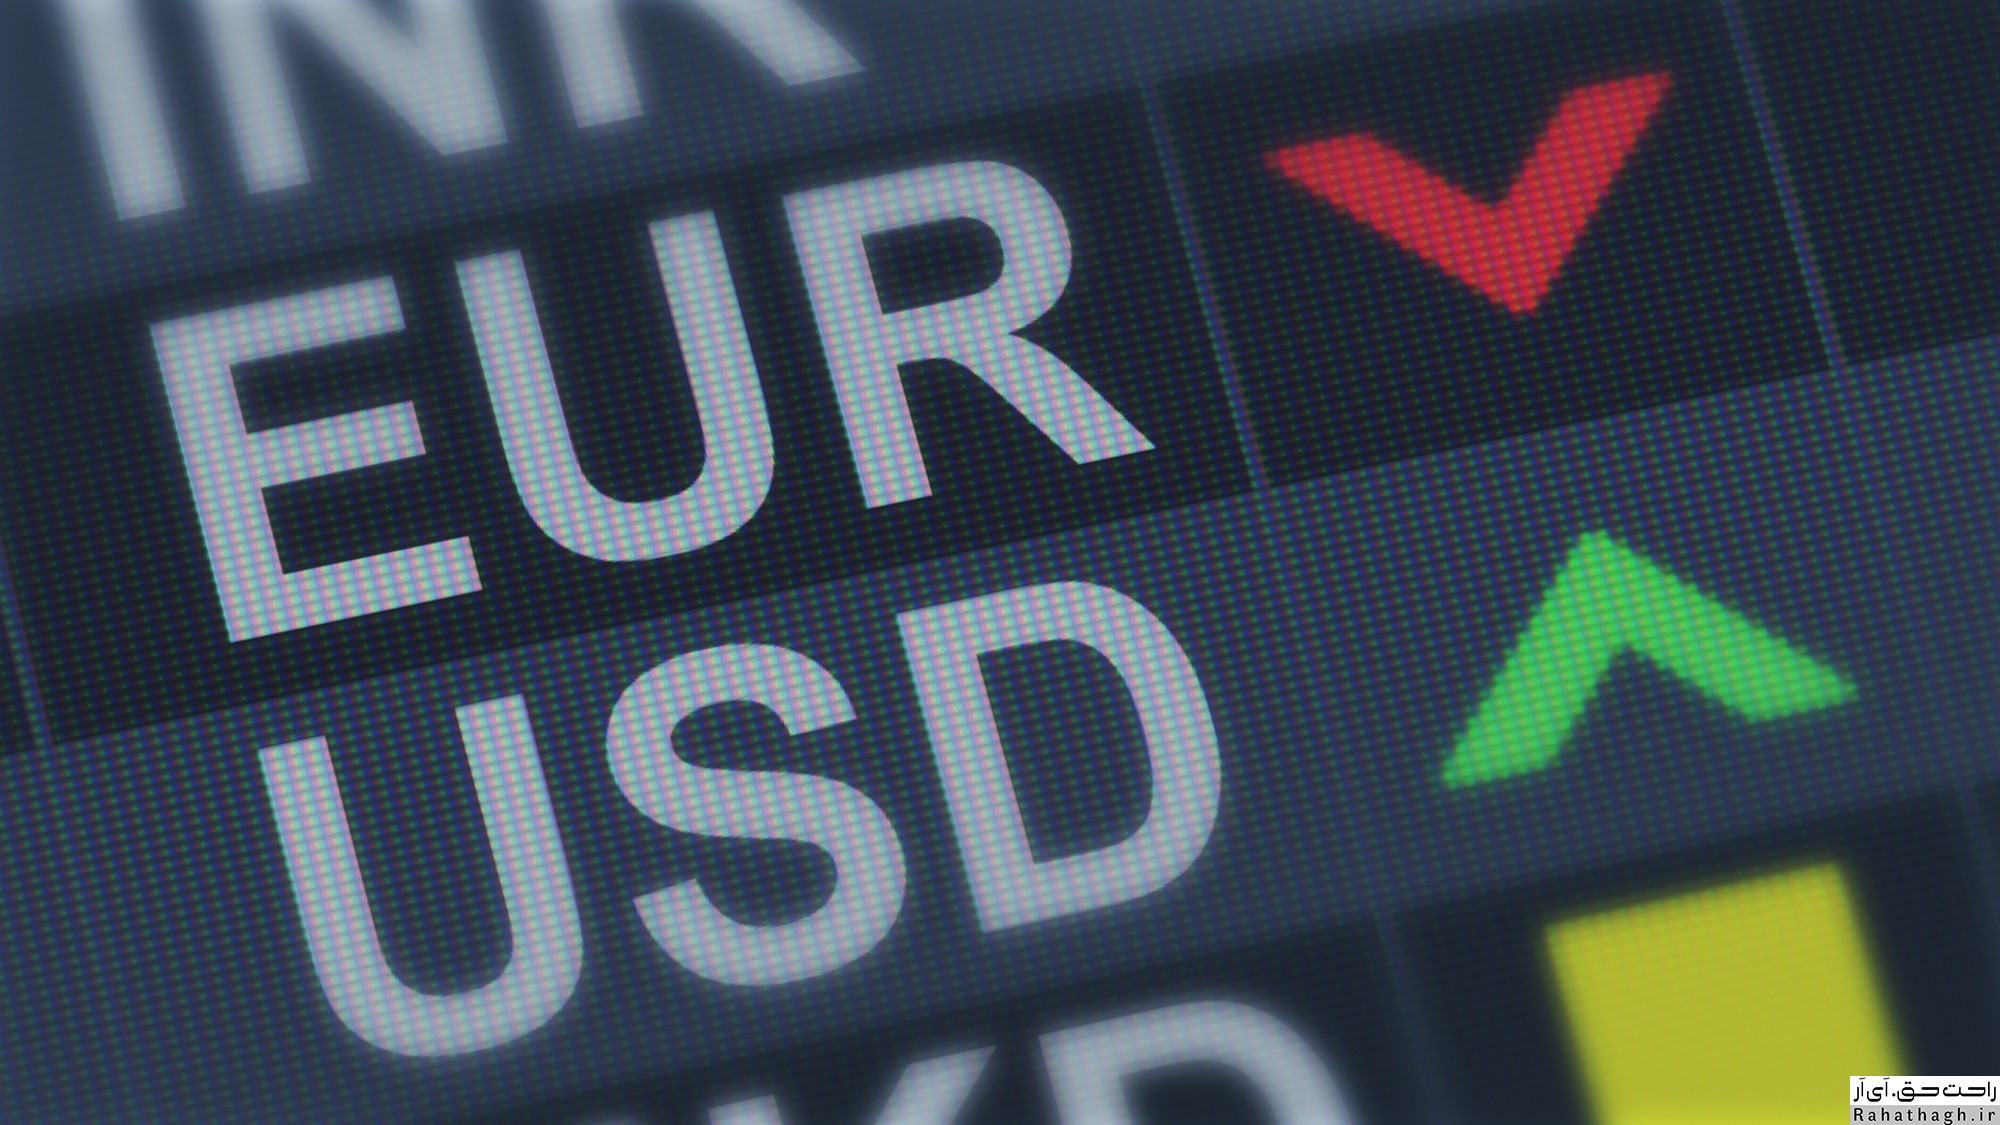
In the EURUSD weekly chart, the market is still bullish, hovering above the key support of $ 1.50. This support can be seen in the EURUSD daily and weekly charts. The $ 1.50 support is also in line with the 50% Fibonacci correction and the daily support trend line. However, the uptrend of the euro against the US dollar seems to be limited, especially since the daily resistance is seen at $ 1.2165.
In the EURUSD four-hour chart, the market is under selling pressure from the resistance of $ 1.2165. This resistance could be a good place to enter a sell trade and lower the euro to the $ 1.2067 support area.

۲۳ بهمن ۹۹ ، ۱۰:۳۶
حمید راحت حق

AUDUSD Wednesday, January 27

AUDUSD Wednesday, January 27

https://bayanbox.ir/view/3208015494907491157/aud-usd-forecast%D8%B1%D8%A7%D8%AD%D8%AA-%D8%AD%D9%82.jpg

The AUDUSD pair continues to fluctuate below 0.7819 and the short-term trend of the Australian dollar against the US dollar is neutral. As long as the $ 0.7641 support holds its position, one can expect another uptrend. In the eyes of buyers, a break of $ 0.7819 could trigger a big uptrend to the estimate of 61.8% of Fibonacci at $ 0.8170. However, in the eyes of sellers, if the AUDUSD falls below $ 0.7641, the short-term market trend will decline to support at $ 0.741.

۰۸ بهمن ۹۹ ، ۱۵:۴۳
حمید راحت حق