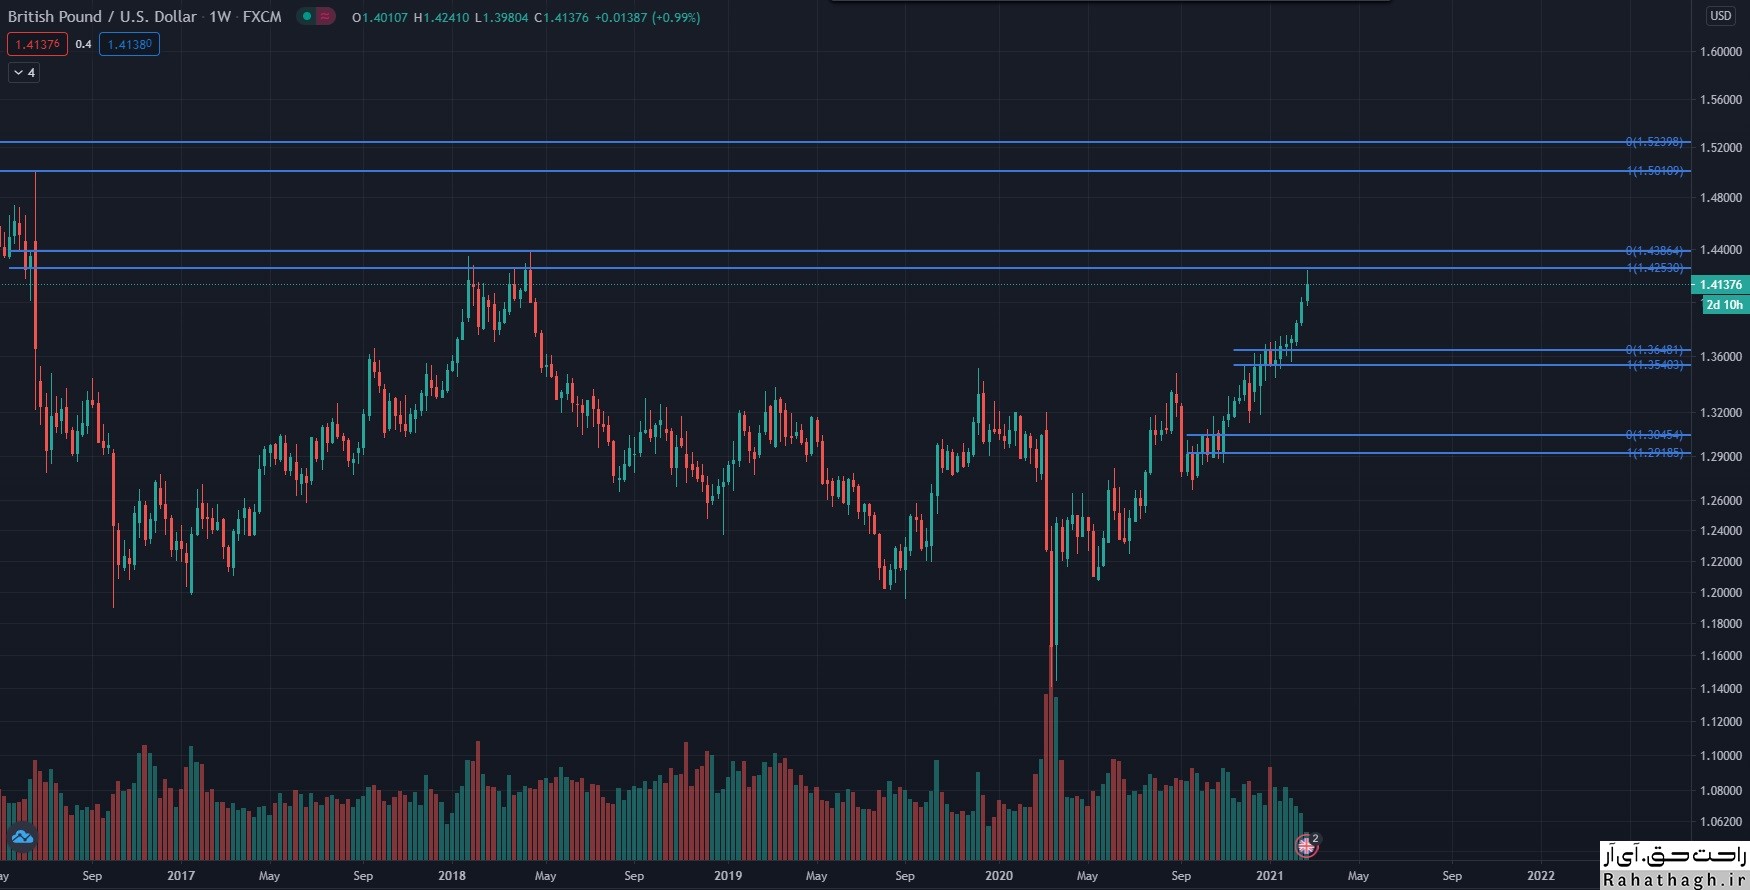
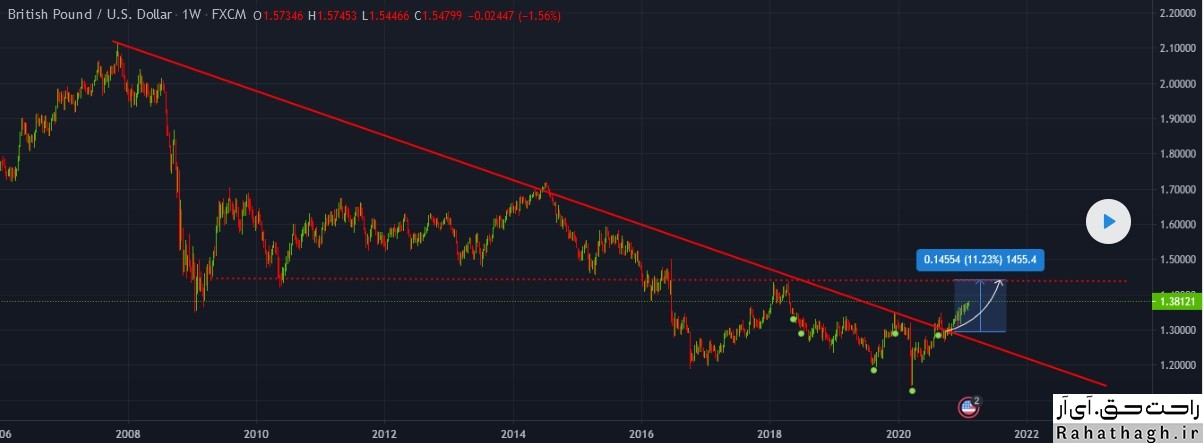
Check the GBPUSD trend
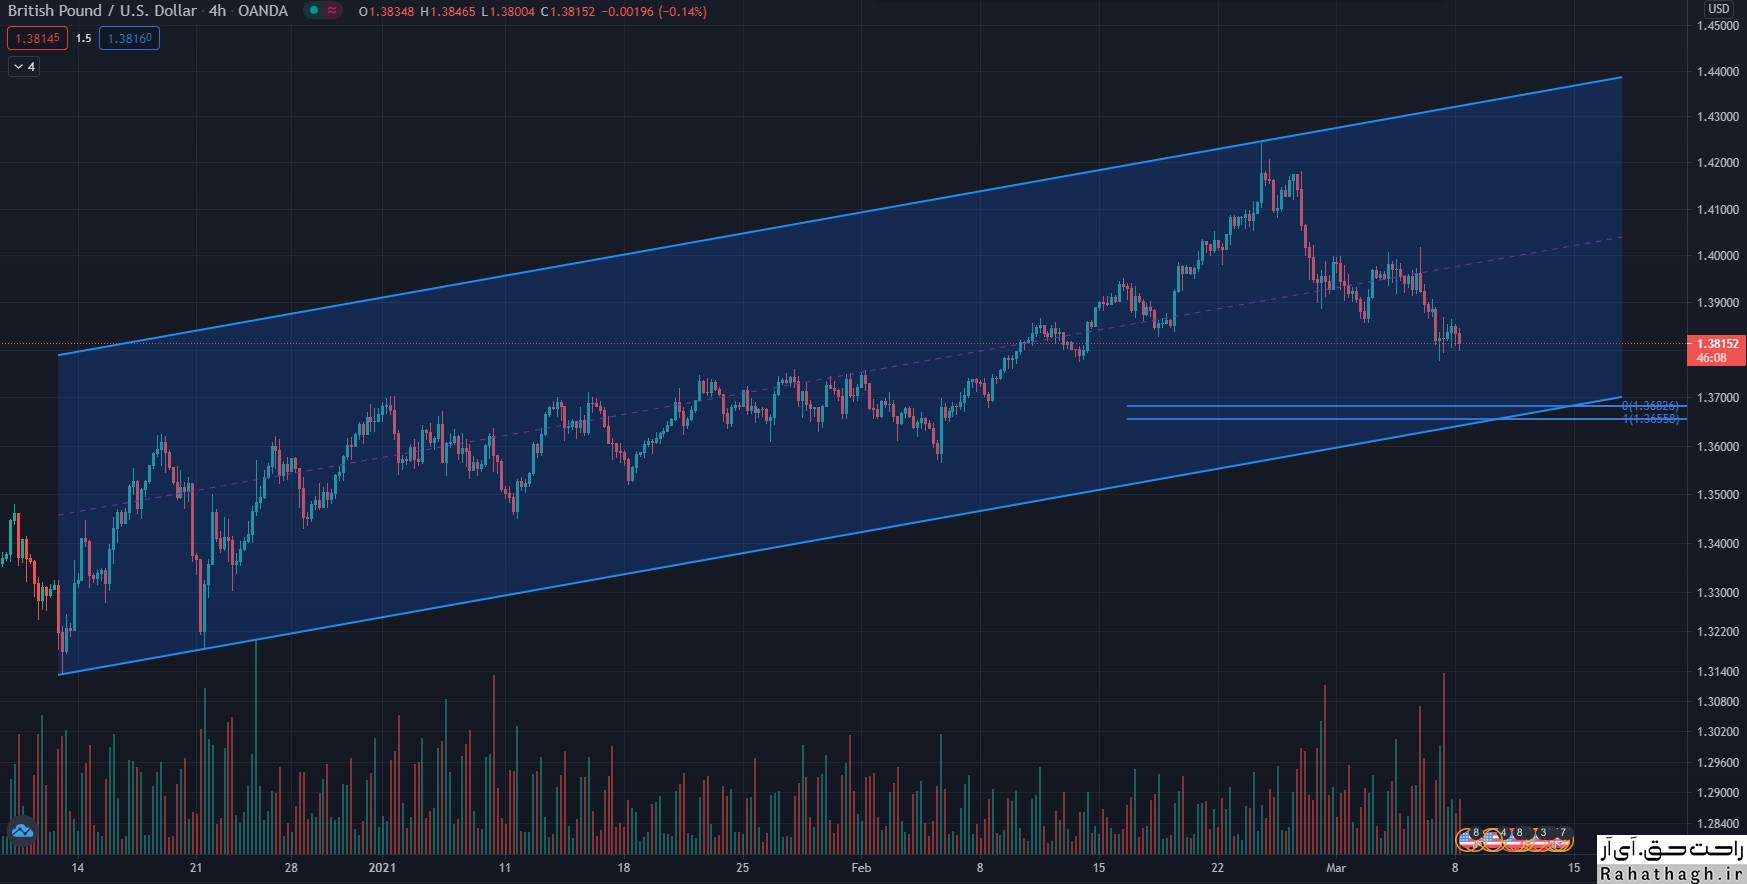
The short-term trend of the British pound against the US dollar is down, and the correction can continue until the 38.2% Fibonacci correction at the rate of $ 1,3642. These levels are expected to turn supportive and the GBPUSD currency pair to return upwards. From the buyers' point of view, if the GBPUSD crosses the above resistance level of $ 1,44016, the pair will be ready to hit $ 1,440 again.