صفحه اصلی تقویم اقتصادی تحلیل رمزارزها (Cryptocurrency) تحلیل طلا (Gold) تحلیل فارکس (Forex) ارتباط با من درباره من
تحلیل طلا (GOLD) :: سایت تحلیل بورس، فارکس و ارز دیجیتال حمید راحت حق| Rahathagh.ir

اخبار و تحلیل نموداری و تکنیکالی بازارهای مالی دنیا اعم از بازار بورس داخلی، بازار فارکس، بازار طلا و بازار ارز دیجیتال و رمزارزها و روانشناسی بازار

۴۷ مطلب با موضوع «تحلیل طلا (GOLD)» ثبت شده است

Weekly analysis of the global Gold Saturday , February 20

Weekly analysis of the global Gold Saturday , February 2
https://bayanbox.ir/view/4164295542326912606/200728-gold-bar-%D8%B1%D8%A7%D8%AD%D8%AA-%D8%AD%D9%82.jpg
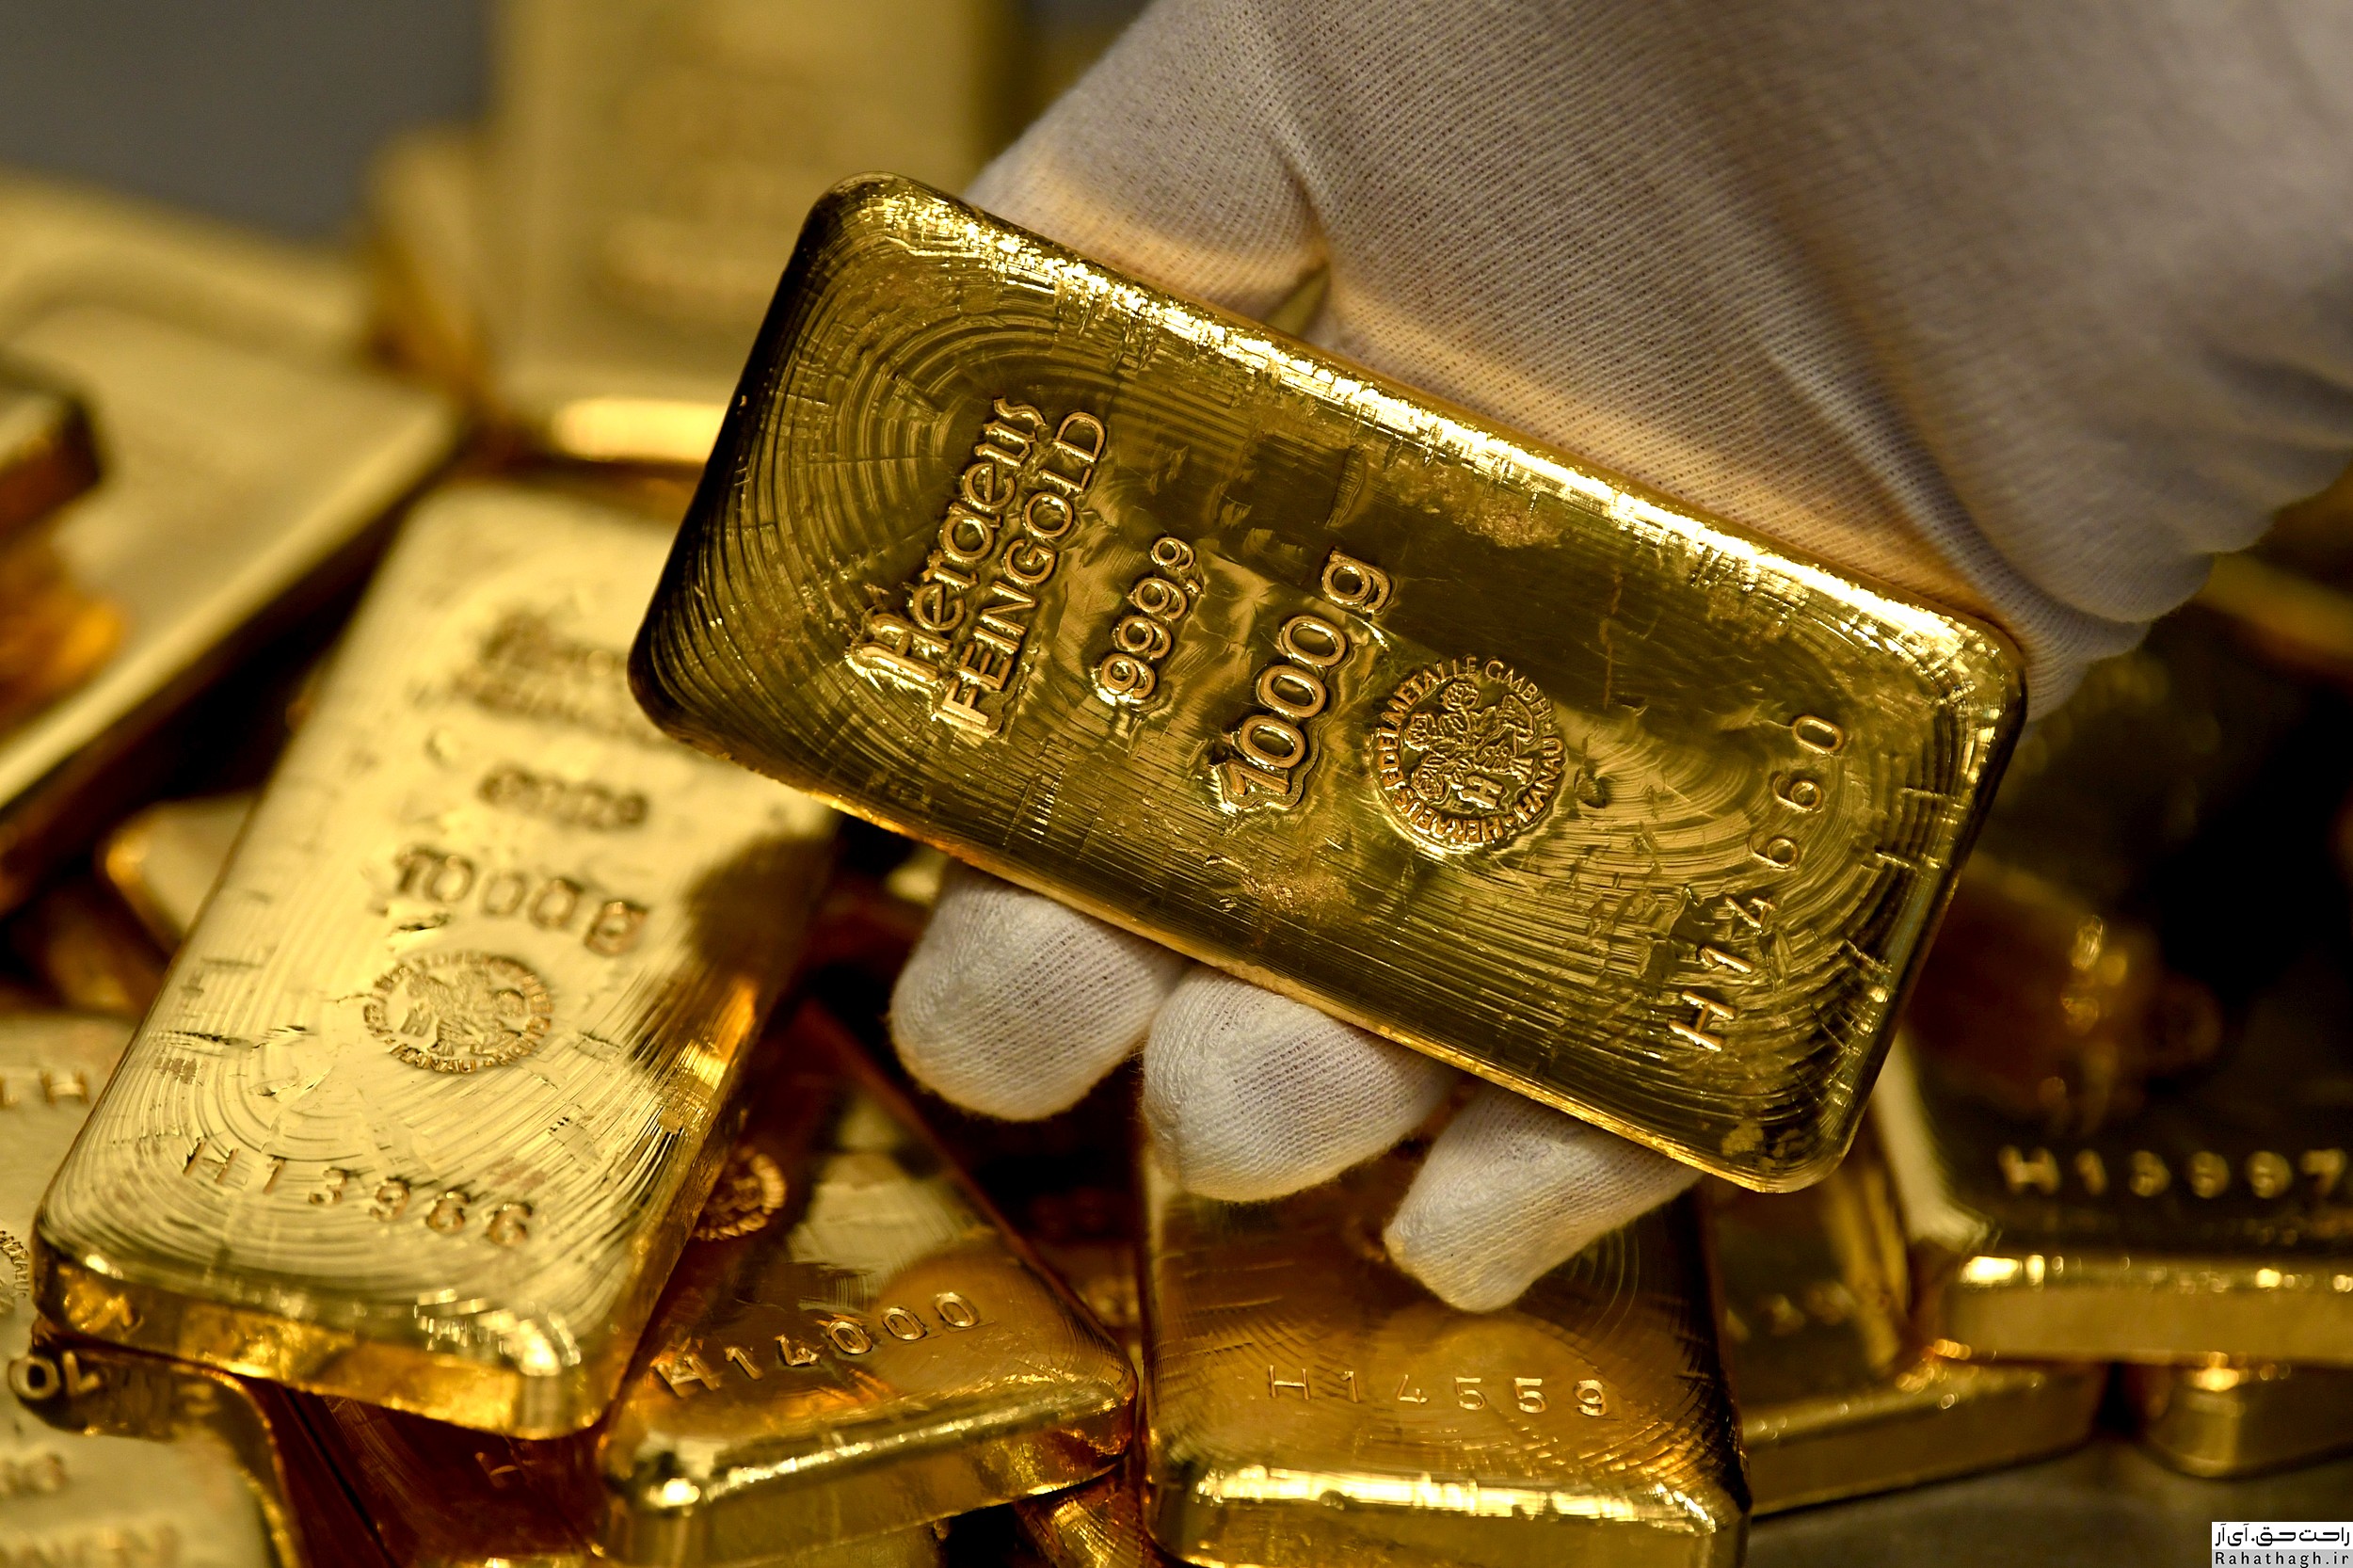
The GOLD price of gold yesterday experienced an upward trend from the lowest level in the last seven months. Gold traded lower at $ 1,760 and rose to $ 1,790 after the official start of trading in the United States.
Gold ended the week at $ 1,780 and fell 2.35% over the past seven days. This is the worst weekly gold performance since July.
After testing the support level of $ 1,765 to $ 1,770, the price of gold was able to start a corrective trend. Stabilizing the price below this level will cause a downward trend.
Similarly, the stabilization of the price above the level of $ 1,790 can be considered a sign of the possibility of an uptrend for gold.
However, the correction in the price of gold seems limited and there is a possibility that the price will fall. Investors' risk appetite has increased as Treasury bond yields have risen. On Friday, the 10-year yield on US Treasury bonds reached a one-year high of 1.35%.

Technical levels
Last price of the day: $ 1783.54
Daily fluctuations: 8.80
Daytime fluctuations (٪): 0.5
Starting price: $ 1774.74
Trends
20-day moving average: $ 1826.92
50-day moving average: $ 1854.34
100-day moving average: $ 1865.24
200-day moving average: $ 1858.94
Levels
Yesterday's highest price: $ 1789.76
Lowest price yesterday: $ 1768.46
Last week's highest price: $ 1855.5
Last week's lowest price: $ 1807.86
Last month's highest price: $ 1959.42
Last month's lowest price: $ 1802.8
Fibonacci 38.2. Daily: $ 178.62
Fibonacci 61.8. Daily: $ 1776.6
Pivot S1 Daily: $ 1765.55
Pivot S2 Daily: $ 1756.35
Pivot S3 Daily: $ 1744.25
Pivot R1 Daily: $ 1786.85
Pivot R2 Daily: $ 1798.95
Pivot R3 Daily: $ 1808.15


۰۲ اسفند ۹۹ ، ۱۵:۳۵
حمید راحت حق

Key points of buying and selling ounces of gold Tuesday, February 16

Key points of buying and selling ounces of gold Tuesday, February 16

https://bayanbox.ir/view/569260838793919456/stack-of-golden-%D8%B1%D8%A7%D8%AD%D8%AA-%D8%AD%D9%82.jpg
Offer: sell below 1812.50 with a first profit tick of 1789.00 and a second profit tick of 1782.00
Alternative offer (in case of price trend change) When the price penetrates above 1812.50, the price first starts moving towards 1818.00 and 1827.00.

Support and resistance points
1827.00
1818.00
1812.50
————————
1789.00
1782.00
1771.75

۲۸ بهمن ۹۹ ، ۱۸:۱۷
حمید راحت حق

Silver Technical Analysis (XAG) Thursday, February 11

Silver Technical Analysis (XAG) Thursday, February 11

https://bayanbox.ir/view/3561361682016821299/stack-of-silver-%D8%B1%D8%A7%D8%AD%D8%AA-%D8%AD%D9%82.jpg
After hitting a high of $ 27.81 at the beginning of the week, the price of silver is experiencing a volatile trend in the range of $ 26.82.
This price correction was accompanied by the formation of a candle pattern with long shadows and is a sign of buyers' reluctance to act. Thus, there is a possibility of further fall in the price of silver.
The first support level is at $ 25.90, the weekly price floor. If the price penetrates below this level, the next target will be $ 24.60 support.
On the other hand, this week's price ceiling of $ 27.81 plays the role of a resistance for buyers.
Technical levels
Last price of the day: $ 26.82
Daytime fluctuations: 0.19-
Daytime fluctuations (٪): -0.70
Starting price: $ 27.01
Trends
20-day moving average: $ 26.2
50-day moving average: $ 25.79
100-day moving average: $ 24.92
200-day moving average: $ 23.28
Levels
Yesterday's highest price: $ 27.53
Yesterday's lowest price: $ 26.82
Last week's highest price: $ 30.07
Last week's lowest price: $ 25.9
Last month's highest price: $ 27.92
Last month's lowest price: $ 24.19
Fibonacci 38.2. Daily: $ 27.09
Fibonacci 61.8. Daily: $ 27.26
Pivot S1 Daily: $ 26.71
Pivot S2 Daily: $ 26.41
Pivot S3 daily: $ 26
Pivot R1 Daily: $ 27.42
Pivot R2 Daily: $ 27.83
Pivot R3 Daily: $ 28.13

۲۳ بهمن ۹۹ ، ۱۰:۴۶
حمید راحت حق

Weekly Gold Analysis Monday, February 7

Weekly Gold Analysis Monday, February 7

https://bayanbox.ir/view/9037470472824552199/gold7-2%D8%B1%D8%A7%D8%AD%D8%AA-%D8%AD%D9%82.jpg

The ounce of global gold in mid-August 2018, in the form of support hit $ 1160 and started a new bullish rally, so that the price of gold rose to $ 2075 over two years. This is a historic price point for gold. The upward movement of gold stopped after hitting the range of 2050-2075 and then we saw the entry of ounces of gold into the downtrend channel, so that the market moved to the moving average of 50.
The ounce of gold was resisted by $ 1875 and the moving average of 20, which resulted in the market moving to an average of 50. An ounce of gold has returned to the upside after each hit. So in this week's trading, if the 50-day moving average and the $ 1800 trend are turned into support, one can expect the market to return to the 20-day moving average, the $ 1875 level and finally the channel ceiling. The failure of the channel resistance can make the presence of gold buyers in the market more colorful.
But if the ounce of gold breaks the $ 1800 trend and the average of $ 50, the downtrend will pave the way around the $ 1700 trend.


Activists and investors in the global gold ounce market are skeptical about the future of the market, according to a weekly assessment by Kitco News. Although the majority of market traders expect the price of an ounce of global gold to rise in the coming weeks, among small investors, supporters of the uptrend are less than 50%.
Meanwhile, the price of an ounce of silver has returned below $ 27 and all growth since the beginning of last week has disappeared. The price of silver has fallen after reaching the highest price of the last eight years. The fall in the price of silver has negatively affected the views and expectations of retail investors. Analysts believe that small investors' pessimism about the silver market has spread to the global ounce gold market. Micro-investors, most influenced by the social network, expected a rapid return to the silver market, and this frustration may spread to the gold market.
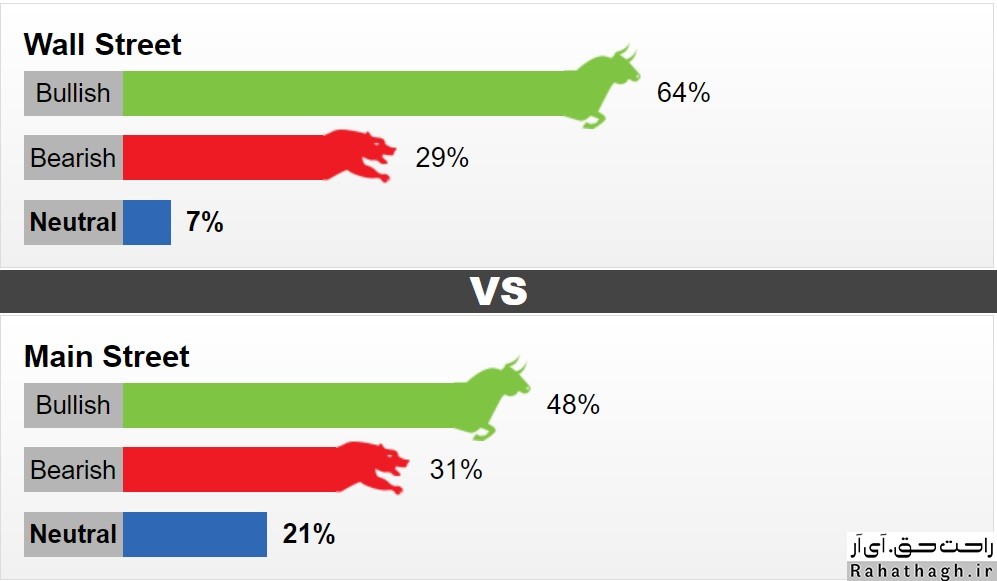
This week, 14 Wall Street activists took part in the weekly evaluation of the Kitco site. 64% predict that this week's trend will be an upward ounce of global gold. Another 29% predict that the market trend will be downtrend and another 7% expect the market to be trending or neutral. A total of 1,823 Main Street activists took part in the online poll. 48% are in favor of the uptrend, 31% are in favor of the downtrend and 21% are in favor of the neutral trend.
Kitco's online poll shows that micro-investor pessimism about the global ounce trend has reached its highest level since late November. At that time, the price of an ounce of world gold had fallen below $ 1,800. Last week, professional activists and small investors expected the price of an ounce of global gold to rise. However, the ounce price of global gold fell by almost 2%.


۱۹ بهمن ۹۹ ، ۱۳:۴۶
حمید راحت حق

Weekly Gold Analysis Monday, February 1

Weekly Gold Analysis

https://bayanbox.ir/view/3070420552967948263/gold2-1%D8%B1%D8%A7%D8%AD%D8%AA-%D8%AD%D9%82.jpg
Kitco's weekly assessment shows that as financial markets fluctuate, small investors are optimistic about the future of the gold market. However, market traders believe that traders should not focus on gold and should instead focus on silver. Last week, the price of silver rose by nearly 7%. Most of last week's silver gains were made on Thursdays and Fridays.
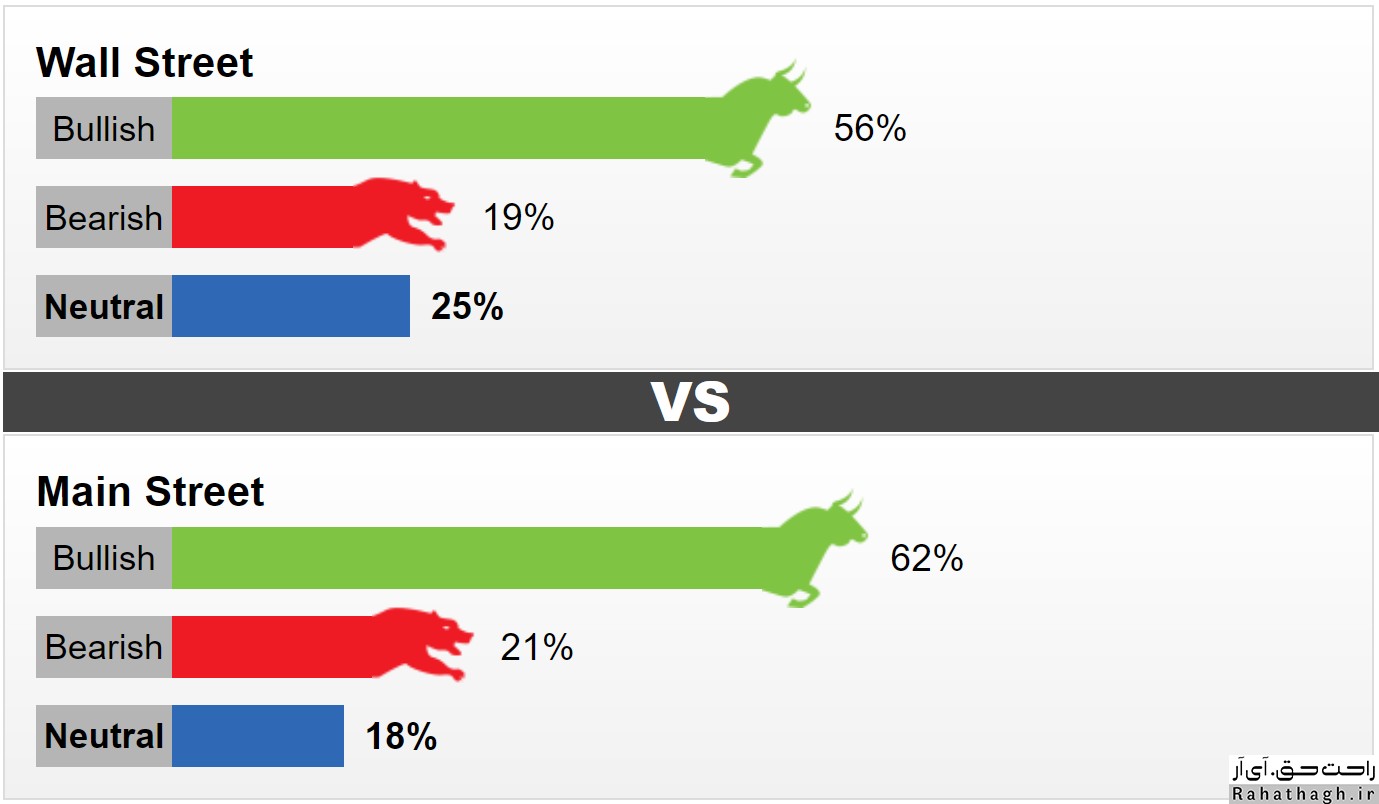
This week, 16 Wall Street activists took part in the weekly Kitco News review. Fifty-six percent of respondents predict that the global gold ounce trend will be bullish. Another 19 percent predict a downward trend and another 25 percent predict a market without a trend. The focus of market participants on silver price movements has also reduced the participation of small investors (Main Street). Less than 1,000 people took part in the Kitco online poll this week. 62% were in favor of the uptrend, 21% were in favor of the downtrend and 18% were in favor of the neutral trend.
Last week, small investors and market traders expected the price of an ounce of global gold to rise. However, the market has ended without significant change.

۱۳ بهمن ۹۹ ، ۱۱:۴۸
حمید راحت حق

GOLD Tuesday, January 26

GOLD Tuesday, January 26

https://bayanbox.ir/view/2148848428967361016/GOLD%D8%AD%D9%85%DB%8C%D8%AF-%D8%B1%D8%A7%D8%AD%D8%AA-%D8%AD%D9%82.jpg


The weekly ounce chart of global gold can bring buyers into the market due to the recent reversal and uptrend. It should also be noted that the weekly chart shows support at $ 1787 and $ 1738 and resistance at $ 1950.
In the XAUUSD daily chart, the market has also reacted positively to the simple moving average of 200 days. Aside from the 1959 high in early January, buyers should also consider the key resistance of $ 1966. Also below the 200-day moving average, $ 1746 support is below the 100% Fibonacci estimate (1756), the 50% Fibonacci retracement at 1762 and the 127.2% Fibonacci estimate at $ 1740.
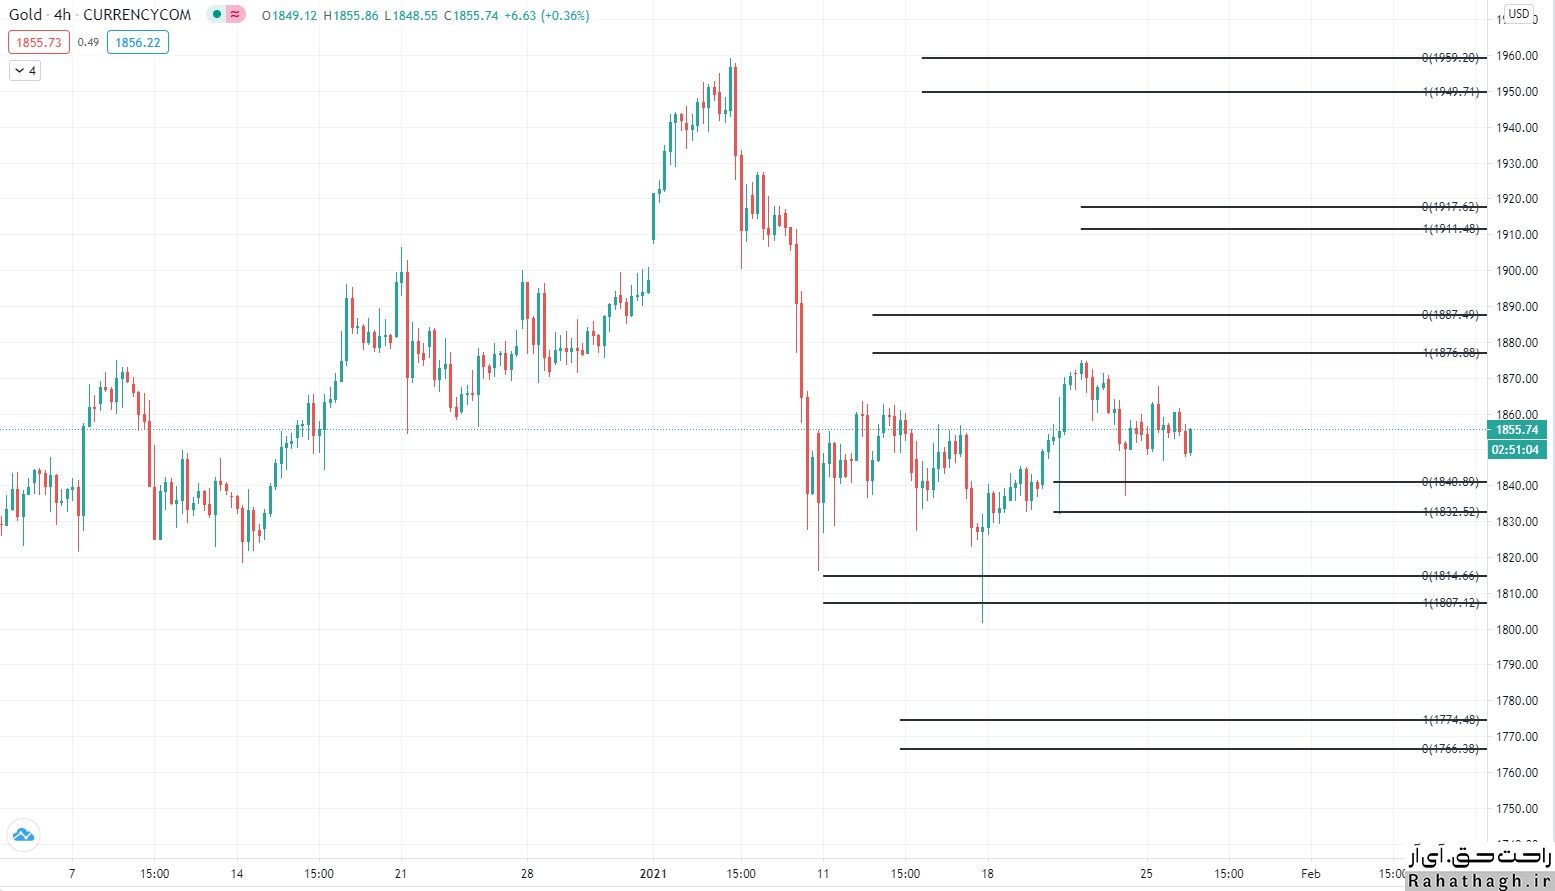
In the four-hour chart, XAUUSD may push market buyers to the November reopening rate of $ 1878. However, if the global ounce of gold falls, it will fall to the support of $ 1822. At the same time, the four-hour AB = CD pattern is completed around $ 1920 and $ 1910, which can bring sellers to market. Although this pattern could lower the price of an ounce of global gold, given the state of long-term charts, the likelihood of a drop in gold prices will be limited.

۰۷ بهمن ۹۹ ، ۱۵:۴۴
حمید راحت حق

Weekly Gold Analysis


https://bayanbox.ir/view/3958381045422639767/photo-2021-01-24-17-45-33.jpg

Weekly Gold Analysis

Even though the strength of the global ounce uptrend has weakened, buyers still support the precious metal. Analysts are assessing the rate of economic growth due to government financial and support packages, as well as the possibility of intensifying inflationary pressures. However, according to Kitco News' weekly assessment, small investors and market participants expect future inflation to determine the trend in the gold market and ultimately push up the price of an ounce of global gold.
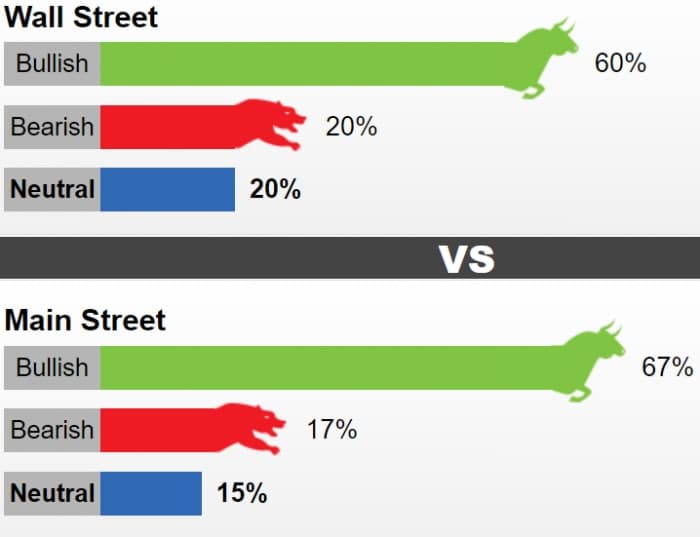
This week, 15 Wall Street activists took part in a weekly Kitco poll. Sixty percent of respondents predict that this week's trend will be an upward ounce of global gold. Another 20 percent predict that the market will decline and the remaining 20 percent predict that the market will be trendless. Meanwhile, 1,581 Main Street investors took part in an online poll. 67% are in favor of an uptrend, 17% are in favor of a downtrend and about 15% are in favor of a trend-free market.
The upward return of the global ounce of gold from $ 1,800 support has caused optimism among market participants. The market reacted positively to this support at the beginning of last week, but the price of an ounce of global gold continued to fall slightly. However, the gold market ended last week's trading in the $ 1855 range. Although the gold market failed to show strong momentum in early 2021, many analysts still do not want to be disappointed with the rise in gold prices, especially as the new US administration seeks to approve a $ 1.9 trillion financial package.


۰۶ بهمن ۹۹ ، ۰۲:۰۲
حمید راحت حق