صفحه اصلی تقویم اقتصادی تحلیل رمزارزها (Cryptocurrency) تحلیل طلا (Gold) تحلیل فارکس (Forex) ارتباط با من درباره من
forex gold trading :: سایت تحلیل بورس، فارکس و ارز دیجیتال حمید راحت حق| Rahathagh.ir

اخبار و تحلیل نموداری و تکنیکالی بازارهای مالی دنیا اعم از بازار بورس داخلی، بازار فارکس، بازار طلا و بازار ارز دیجیتال و رمزارزها و روانشناسی بازار

۴ مطلب با کلمه‌ی کلیدی «forex gold trading» ثبت شده است

Gold trading opportunities today - Monday, April 19

Gold trading opportunities today - Monday, April 19

https://s19.picofile.com/file/8431209800/centralgold_19_4_%D8%B1%D8%A7%D8%AD%D8%AA_%D8%AD%D9%82.png

Offer: Buy a deal above the point of 1766.00 with the first tick of 1784.00 and the second tick of 1796.00

Alternative offer (in case of price trend change) When the price falls below 1766.00, the price first starts moving towards 1759.00 and 1749.00.

Support and resistance points
1808.00
1796.00
1784.00

1766.00
1759.00
1749.00

۳۰ فروردين ۰۰ ، ۱۰:۳۲
حمید راحت حق

Weekly Gold Analysis Saturday, April 3

Weekly Gold Analysis Saturday, April 3

https://s17.picofile.com/file/8429459934/gold_4_3_%D8%B1%D8%A7%D8%AD%D8%AA_%D8%AD%D9%82.jpg
The price of gold has been on the rise despite the growth of employment in the United States. In March, the United States, the world's largest economy, created 916,000 jobs. If inflation continues, will the Fed raise interest rates and reduce the attractiveness of gold for investment? The answer to this question is complicated! But first, gold must be examined technically.
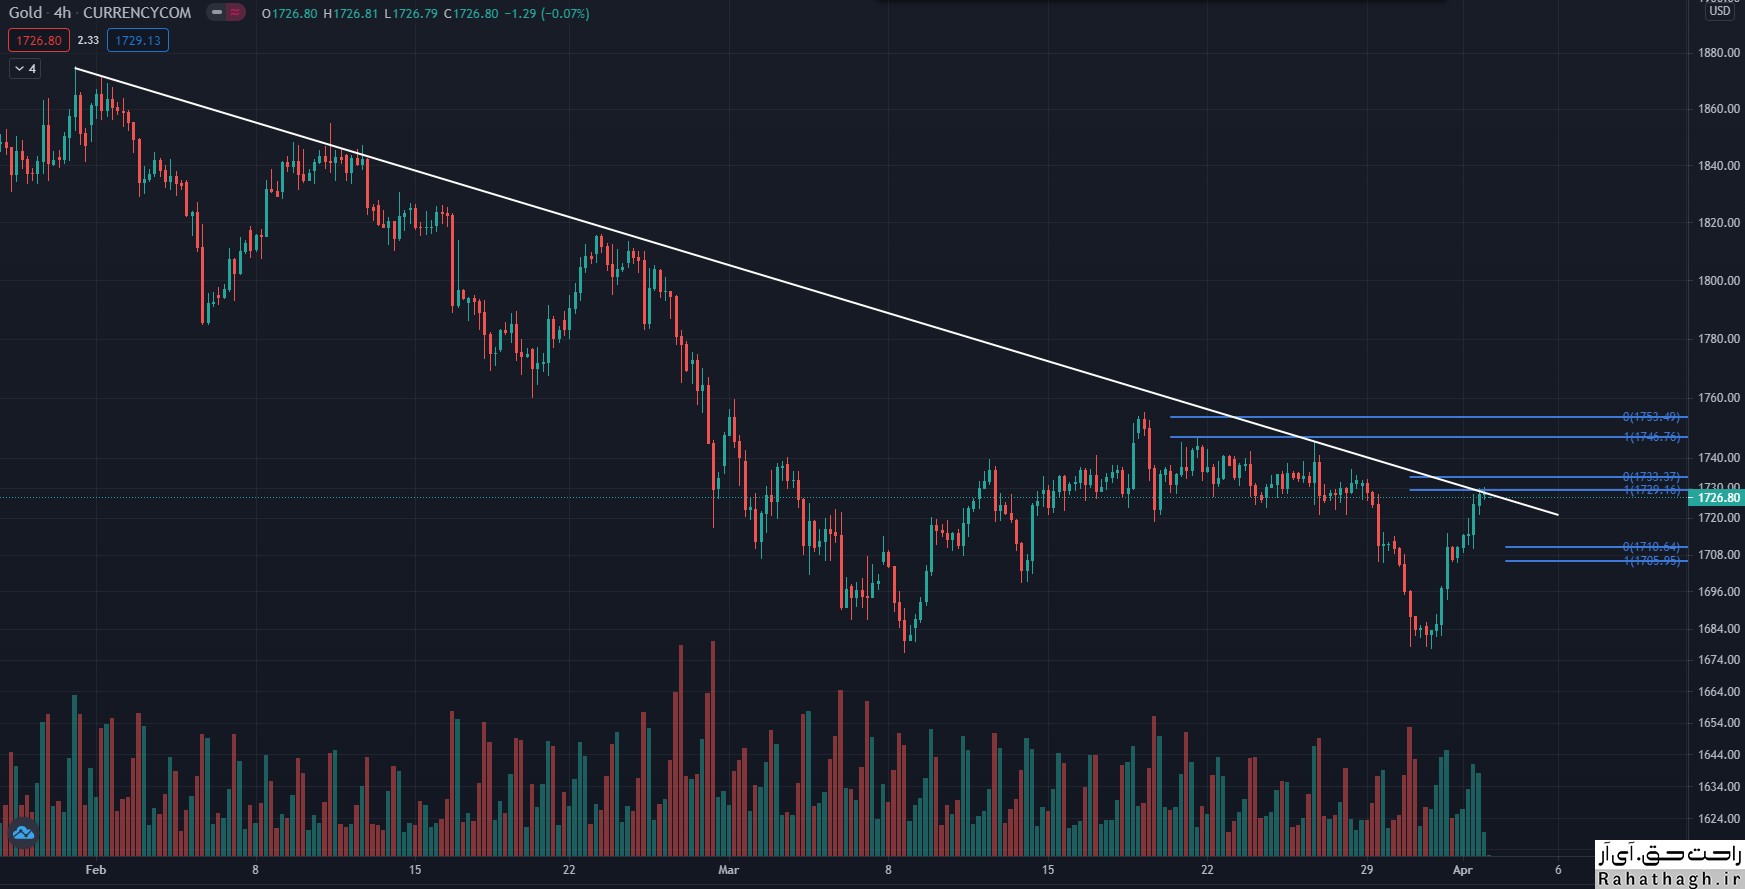
According to the TCI indicator, a significant support level is formed at $ 1,738. This level is the intersection of the middle band of the Bollinger Band indicator in a four-hour time frame with levels of 23.6% weekly Fibonacci and 61.8% monthly Fibonacci.
If this support level is broken, the next target will be the level of $ 1,708. In this range, the 100-hour moving average indicator and the weekly S2 pivot hit a level of 38.2% Fibonacci monthly.

On the other hand, the first resistance level is formed at $ 1,732 (the intersection of the upper band of the Bollinger Band indicator and the level of 38.2% Fibonacci weekly).
If this resistance level is broken, the next target will be the $ 1,747 level. This resistance is formed at the intersection of the daily P2 R2 and the weekly R1.

۱۴ فروردين ۰۰ ، ۱۱:۰۴
حمید راحت حق

Gold Analysis Thursday, March 25

Gold Analysis Thursday, March 25

https://s17.picofile.com/file/8428783792/gold_%D8%B1%D8%A7%D8%AD%D8%AA_%D8%AD%D9%82.jpg
The price of the global ounce of gold fluctuated around $ 1,735 at the beginning of Thursday and has not yet managed to cross the $ 5 range. The price is currently fluctuating within the indicator of the 200-hour moving average and is nearing the end of the symmetrical triangle pattern.
Given the low volatility trend of the RSI indicator, one can expect the price to move only if the resistance of $ 1,738 or support of $ 1,725 ​​is broken. On the other hand, the 78.6% Fibonacci level at $ 1,720 and the monthly price ceiling at $ 1,755 play the role of support and resistance levels, respectively.
If the price fails to maintain the corrective trend at the beginning of March and the US dollar index grows, then sellers will be able to control the market for a longer period of time.

Technical levels
Last price of the day: $ 1734.48
Daytime fluctuations: 0.48-
Daytime fluctuations (٪): 0.03-
Starting price: $ 1734.96
Trends
20-day moving average: $ 1726.26
50-day moving average: $ 1787.01
100-day moving average: $ 1826.41
200-day moving average: $ 1860.65
Levels
Yesterday's highest price: $ 1738.48
Yesterday's lowest price: $ 1723.86
Last week's highest price: $ 1755.59
Last week's lowest price: $ 1719.3
Last month's highest price: $ 1871.9
Last month's lowest price: $ 1717.24
Fibonacci 38.2. Daily: $ 1732.9
Fibonacci 61.8. Daily: $ 1729.44
Pivot S1 Daily: $ 1726.39
Pivot S2 Daily: $ 1717.81
Pivot S3 Daily: $ 1711.77
Pivot R1 Daily: $ 1741.01
Pivot R2 Daily: $ 1747.05
Pivot R3 Daily: $ 1755.63

۰۵ فروردين ۰۰ ، ۱۳:۳۴
حمید راحت حق

Weekly analysis of the global Gold Saturday , February 20

Weekly analysis of the global Gold Saturday , February 2

https://bayanbox.ir/view/4164295542326912606/200728-gold-bar-%D8%B1%D8%A7%D8%AD%D8%AA-%D8%AD%D9%82.jpg
The GOLD price of gold yesterday experienced an upward trend from the lowest level in the last seven months. Gold traded lower at $ 1,760 and rose to $ 1,790 after the official start of trading in the United States.
Gold ended the week at $ 1,780 and fell 2.35% over the past seven days. This is the worst weekly gold performance since July.
After testing the support level of $ 1,765 to $ 1,770, the price of gold was able to start a corrective trend. Stabilizing the price below this level will cause a downward trend.
Similarly, the stabilization of the price above the level of $ 1,790 can be considered a sign of the possibility of an uptrend for gold.
However, the correction in the price of gold seems limited and there is a possibility that the price will fall. Investors' risk appetite has increased as Treasury bond yields have risen. On Friday, the 10-year yield on US Treasury bonds reached a one-year high of 1.35%.

Technical levels
Last price of the day: $ 1783.54
Daily fluctuations: 8.80
Daytime fluctuations (٪): 0.5
Starting price: $ 1774.74
Trends
20-day moving average: $ 1826.92
50-day moving average: $ 1854.34
100-day moving average: $ 1865.24
200-day moving average: $ 1858.94
Levels
Yesterday's highest price: $ 1789.76
Lowest price yesterday: $ 1768.46
Last week's highest price: $ 1855.5
Last week's lowest price: $ 1807.86
Last month's highest price: $ 1959.42
Last month's lowest price: $ 1802.8
Fibonacci 38.2. Daily: $ 178.62
Fibonacci 61.8. Daily: $ 1776.6
Pivot S1 Daily: $ 1765.55
Pivot S2 Daily: $ 1756.35
Pivot S3 Daily: $ 1744.25
Pivot R1 Daily: $ 1786.85
Pivot R2 Daily: $ 1798.95
Pivot R3 Daily: $ 1808.15

۰۲ اسفند ۹۹ ، ۱۵:۳۵
حمید راحت حق