صفحه اصلی تقویم اقتصادی تحلیل رمزارزها (Cryptocurrency) تحلیل طلا (Gold) تحلیل فارکس (Forex) ارتباط با من درباره من
BITCOIN ANALYSIS :: سایت تحلیل بورس، فارکس و ارز دیجیتال حمید راحت حق| Rahathagh.ir

اخبار و تحلیل نموداری و تکنیکالی بازارهای مالی دنیا اعم از بازار بورس داخلی، بازار فارکس، بازار طلا و بازار ارز دیجیتال و رمزارزها و روانشناسی بازار

۳ مطلب با کلمه‌ی کلیدی «BITCOIN ANALYSIS» ثبت شده است

Bitcoin Analysis Sunday, April 4

Bitcoin Analysis Sunday, April 4

https://s16.picofile.com/file/8429575268/bitcoin_%D8%B1%D8%A7%D8%AD%D8%AA_%D8%AD%D9%82.jpg
Last week, the price of Bitcoin surpassed $ 55,500 with a steady rise. The BTC / USD pair also broke the $ 58,000 resistance and was higher than the simple moving average of 100 (4 hours).

The pair even crossed the $ 59,500 level and continued its upward trend above the $ 60,000 resistance. However, the price did not close above the $ 60,000 level, but the price ceiling was set at around $ 60,030, after which a new downward trend began. In this downtrend, the support levels of $ 58,500 and $ 58,000 were broken.

The price of Bitcoin fell below the correction level of 23.6% Fibonacci retracement of the volatile price of $ 50,465 fell to the price level of $ 60,630. The BTC / USD 4-hour chart also shows a price break below a bullish uptrend line with support near $ 59,000.

The pair touched the $ 56500 support area and the simple moving average of 100 (4 hours). In addition, another uptrend line has formed with support at nearly $ 56,800 in the same chart.

If below the trend line support, the level of $ 56,500 and the simple moving average of 100 (4 hours) we see a downward price break, there is a possibility of a sudden fall to $ 55,250. This level is close to the 50% Fibonacci retracement level of the $ 50,465 uptrend to $ 60,630. Any further reductions may touch the $ 53,800 level.

If Bitcoin can stay above the $ 56500 support and the simple moving average of 100 (4 hours), it will probably face a price increase again.

The first major resistance to bitcoin is nearing $ 58,000. Closing the price above the $ 58,000 level could pave the way for a move to the 60,000 resistance area. The next major hurdle is close to $ 62,000.

Technical indicators

The MACD is accelerating hourly for the BTC / USD pair in the downtrend area.

The hourly RSI for the BTC / USD pair is currently below the 50 level.

Main Support: $ 56500

Main resistors: $ 58,000

۱۵ فروردين ۰۰ ، ۱۲:۰۶
حمید راحت حق

Bitcoin Analysis Thursday, March 25

Bitcoin Analysis Thursday, March 25

https://s17.picofile.com/file/8428782592/what_is_bitcoin_cryptocurrency_001.jpg
Yesterday, Bitcoin was able to reach levels above $ 55,500 and $ 56,000 with the start of a proper recovery process. BTC even crossed the $ 57,000 resistance and the simple moving average of 100 (hourly).

However, the currency failed to continue its uptrend further, and as a result, resumed its downward trend after forming a price ceiling at $ 57,235. In the hourly chart of the BTC / USD pair, a price break is seen below a major uptrend line with support near $ 54,220.

The price of Bitcoin fell even below the support level of $ 54,000 and the pivot level of $ 53,200. Following this downward trend, the weekly price floor formed around the level of $ 51634 and bitcoin entered the consolidation phase. The first resistance is near the level of $ 53,000, which is near the correction level of 23.6% Fibonacci, the downward trend of $ 57,235 to $ 51634.

The first major resistance to this market cryptocurrency is near the $ 53,200 pivot level. If we see the price rise again above the $ 53,200 level, the probability of reaching the $ 54500 level increases. The 50% Fibonacci retracement level is down from $ 57,235 to $ 51634 and close to $ 54500.

If the bitcoin correction trend does not lead to levels above $ 53,200 and $ 545,500, in the short term it is more likely to continue its downward trend. In this case, the first support will be close to the level of $ 51,500.

The first major support is now close to the $ 51,000 level, below which the $ 50,000 support area is likely to be touched. Any further price cuts could lead to a move to the $ 48,000 level.

Technical indicators

The hourly MACD for the BTC / USD pair is slowly accelerating in the downtrend.

The hourly RSI for the BTC / USD pair is now below the 40 level.

Main support: $ 51,000 and $ 50,000

Main resistances: 53200, 54500 and 55000 dollars

۰۵ فروردين ۰۰ ، ۱۳:۱۵
حمید راحت حق

Bitcoin Analysis (BTC) Wednesday, February 17

Bitcoin Analysis (BTC) Wednesday, February 17

https://bayanbox.ir/view/5541391780580057507/BTC-%D8%B1%D8%A7%D8%AD%D8%AA-%D8%AD%D9%82.jpg
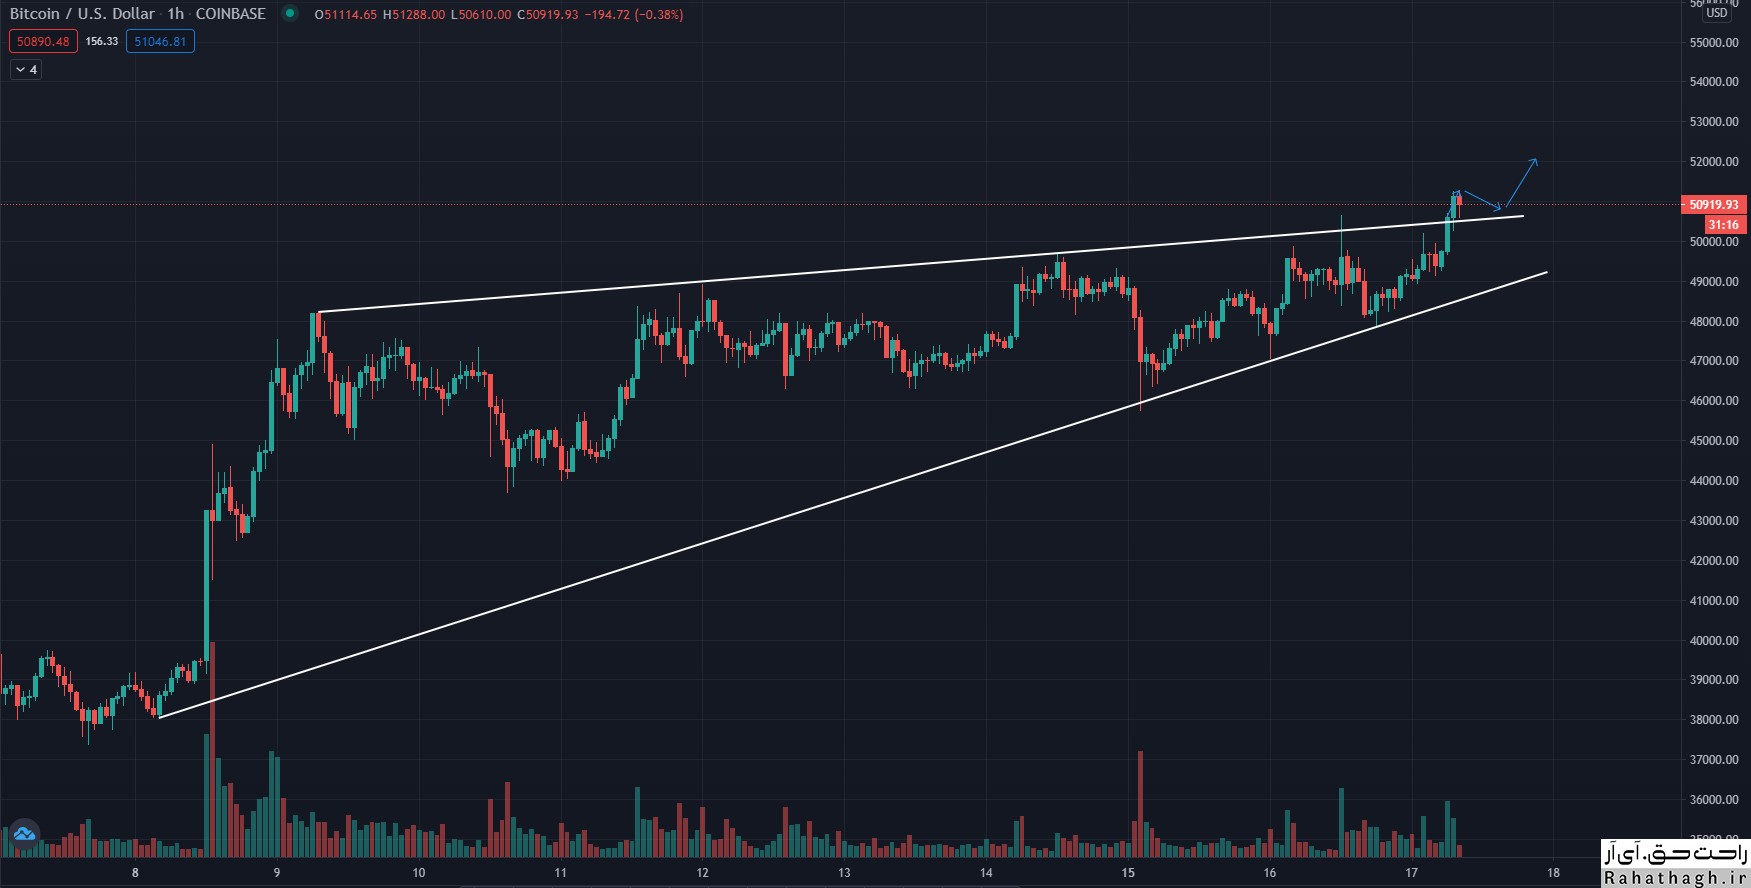
Bitcoin prices regained their uptrend and broke the $ 50,000 resistance. BTC is maintaining a profit and seems to be moving further towards 52000.

Expand profitability

The price of bitcoin finally managed to cross the $ 50,000 resistance area. BTC climbed above the $ 50,200 and $ 50,500 levels and traded at the new $ 50,600 level before correcting the downtrend. There was a Sharpe correction below the $ 50,000 level. The price even fell below the $ 49,000 support level. However, the cows were able to stay close to the $ 48,000 area and the simple 100-hour moving average. A floor formed near the level of $ 47,819 and the price is currently rising.

Bitcoin above the Fibonacci retracement level trades 50% down from the $ 50,000 to $ 47,819. There was also a break above the key contraction triangle with resistance near 49,500 on the BTC / USD chart.
 The price trades well above $ 50,000 and is completely above the simple moving average of 100 hours and is testing the Fibonacci retracement level of 76.4% downward from the $ 50,000 swing ceiling to the $ 47,819 floor.

It seems that the upward trend of the price towards the ceiling of $ 50,600 will continue. A further climb could easily push the price towards the 51000 level. The next key resistance is at $ 52,000.

BTC fall again?

If Bitcoin fails to stay above the $ 50,000 and $ 50,200 levels, a bearish correction will occur. Initial support is near the $ 49,500 level and the broken triangle trend line.

A break below $ 49,500 could push the price towards $ 48,000 support. The simple 100-hour moving average is also set to support close to $ 48,000.

 Technical indicators:

Indicator of moving average convergence Hourly divergence in the cattle area.

The hourly relative strength index is currently above the 50 level.

Main support levels: $ 49,500 and then $ 49,000.

Main resistance levels: $ 50,000, $ 51,000 and $ 52,000.

۲۹ بهمن ۹۹ ، ۱۲:۰۲
حمید راحت حق