صفحه اصلی تقویم اقتصادی تحلیل رمزارزها (Cryptocurrency) تحلیل طلا (Gold) تحلیل فارکس (Forex) ارتباط با من درباره من
طلای جهانی اونس :: سایت تحلیل بورس، فارکس و ارز دیجیتال حمید راحت حق| Rahathagh.ir

اخبار و تحلیل نموداری و تکنیکالی بازارهای مالی دنیا اعم از بازار بورس داخلی، بازار فارکس، بازار طلا و بازار ارز دیجیتال و رمزارزها و روانشناسی بازار

۵ مطلب با کلمه‌ی کلیدی «طلای جهانی اونس» ثبت شده است

Global :Gold: Analysis Today Thursday, June 24

Global Gold Analysis Today Thursday, June 24

https://bayanbox.ir/view/619072521286405759/gold-%D8%B1%D8%A7%D8%AD%D8%AA-%D8%AD%D9%82.jpg

On Wednesday, gold had another bullish day, largely driven by sentiment over the US dollar and the Fed's monetary policy stance. The gold price broke the trend and reached its highest daily rate after hitting the PMI index of market services and the new rate of home sales in the US eased inflation concerns and severely affected the US dollar index. Reached $ 1795.

 The selling pressure created during the last week and the subsequent downward consolidation trend has led to the formation of a flag pattern. The closing of the daily price below the support level of the uptrend at $ 1768 confirms the downward failure of the continuing pattern.

After that, a defense line at the lowest level of the last two months, the level of $ 1761, will be waiting for this precious metal. If this level is crossed, the $ 1750 psychological barrier will be activated.

As the downtrend continues, the lowest price level recorded in mid-April, around $ 1,725, could temporarily stop the cows. The relative resistance index (RSI) is falling towards the saturation territory at 32.71 and indicates that there is still a possibility of price reduction.

As the downward trend intensifies, the price of gold will be on the verge of confirming the formation of a "cross of death", while the daily moving average of 200 (DMA) from above will cut the daily moving average of 50.

On the other hand, if buyers manage to stabilize above the $ 1794 level, the 100-DMA cross and support of the downtrend line will lead to the failure of this pattern.

In this uptrend, the highest price recorded on June 18 at the level of $ 1797 before the re-touch of the level of $ 1800 is on the agenda of cows.

۰۳ تیر ۰۰ ، ۱۰:۴۷
حمید راحت حق

Kitco's weekly [estimate] of the {gold market} Sunday, May 16

Kitco's weekly estimate of the gold market Sunday, May 16

https://bayanbox.ir/view/6637263442417937311/kitco-16-5-%D8%B1%D8%A7%D8%AD%D8%AA-%D8%AD%D9%82.jpg
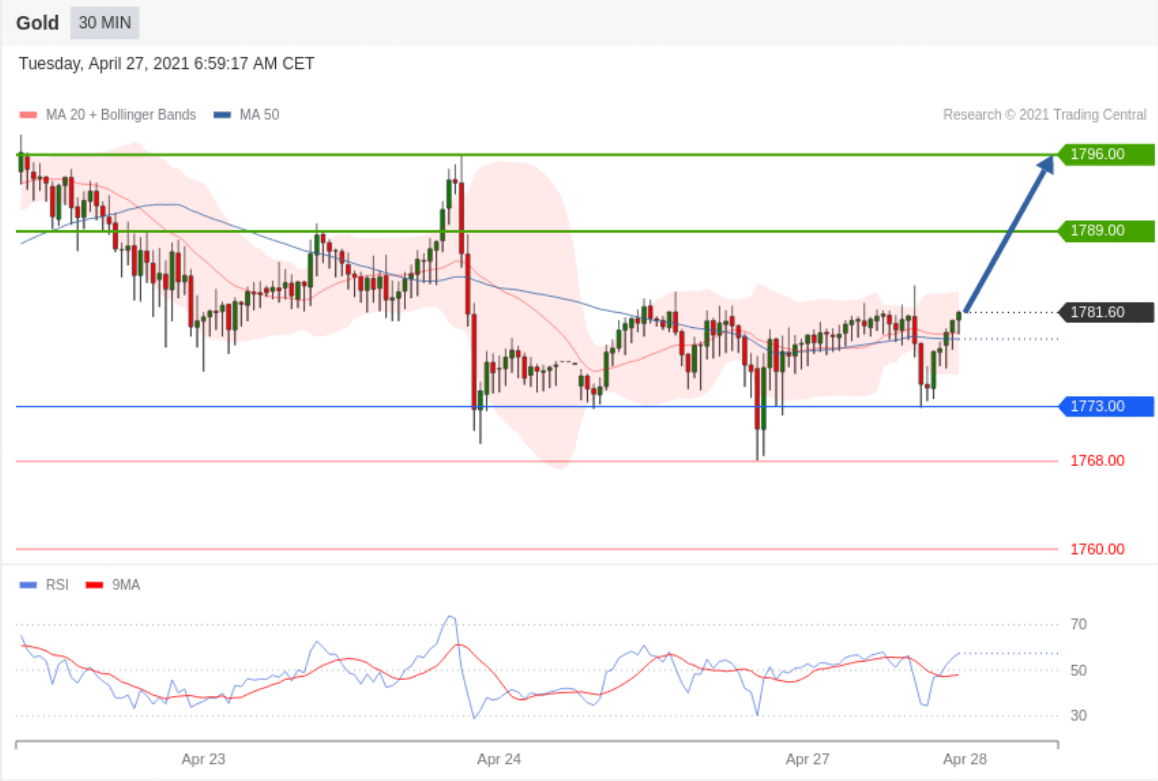
According to Kitco News's weekly assessment, rising inflationary pressures and worries about the uncertain future of the global economy have once again supported the ounce of global gold. Gold market fluctuations increased last week. Market participants believe that the price of an ounce of global gold could exceed $ 1850. Such a move could be significant in terms of technical analysis. Especially since the $ 1850 resistance range indicates the key correction level and the 200-day moving average.
This week, 13 Wall Street activists took part in the weekly evaluation of the Kitco site. 77% predict that the ounce trend of global gold in the next week's trading will be upward. 8% predict that it will be a downward trend. Another 15% expect a trend-free or neutral market. Meanwhile, 464 Main Street investors took part in the online poll. 71% are in favor of an uptrend, 17% are in favor of a downtrend and 11% are in favor of a neutral or no trend market. This week, due to technical problems, the number of participants in the online poll was lower than in previous periods.

Expert opinion of market professionals

Robin Bhar Independent Market Analyst

"The big question on everyone's mind is whether the Fed will get out of expansionary monetary policy sooner than previously predicted due to the rapid rise in inflation," he said. Although inflation has picked up, I think the Federal Reserve can handle the situation. The longer monetary expansionary policies take, the better for gold. "As inflation curves eased, inflation could be justified, but the growth of US economic data has been unbalanced (which is why the Federal Reserve may not be paying attention to rapid inflation at this time)."

Sean Lusk is the CEO of Walsh Trading

Lusk is optimistic about the global ounce uptrend, but not because of rapid inflation, but because of escalating tensions in the Middle East. "I think the global ounce price of gold could be a destination for risk aversion," he said. "It is likely that the price of XAUUSD could cross the key level of $ 1850." He added that the ultimate target of gold is around $ 1900 and after entering the neutral phase, the upward and long-term trend of the market will be revived.

Adrian Day, President of Adrian Investment Management Company

Adrian Dee believes that as inflationary pressures intensify, investors will flock to gold to cover the risk of inflation. "The gold market has changed and investors who left the market in the second half of 2020 are entering the market again. "The Fed may reiterate that rapid inflation is temporary, but in the gold market, rapid inflation is not temporary."

Darin Newsom Independent Market Analyst

Newsam is optimistic about the medium-term ounce of global gold. According to him, the dollar will weaken further. However, he believes that the resistance of $ 1843 is a serious obstacle for the market.

Adam Button is a professional market activist

The professional believes that after a bullish break of $ 1,800, the market will enter a neutral phase for a while. "The price of an ounce of world gold has jumped well from the March price floor and now is the time for the market to rest."

Marc Chandler is the CEO of Bannockburn Global Forex

The professional activist said that although the price of an ounce of global gold has experienced good growth, caution should still be exercised. In his view, the recent rise in gold prices is a bit rapid and the market needs to improve. "It seems that the price of an ounce of global gold wants to hit the 1845-1845 resistance zone, which is the moving average of 200 days. Technical indicators have entered the saturation level. "I think a better market is better for selling than buying, but this week I will focus on treasury rate fluctuations to find new clues."

۲۶ ارديبهشت ۰۰ ، ۱۴:۱۴
حمید راحت حق

Global Gold Analysis Friday, May 14

Global Gold Analysis Friday, May 14

https://s19.picofile.com/file/8433603134/gd_fx_%D8%B1%D8%A7%D8%AD%D8%AA_%D8%AD%D9%82.jpg After forming a price floor in the range of $ 1,809 yesterday, the price of an ounce of global gold reached the resistance level of $ 1,820.

April US retail sales are expected to increase by about 1%. This rate was reported in March at 9.7%. If this happens, the price of gold could experience an upward trend.

The price of gold is moving towards the 200-day moving average indicator in the range of $ 1,847. To achieve this, a high price resistance level of $ 1,840 is required.
On the other hand, if the price penetrates below yesterday's price floor of $ 1,809, one can expect a fall to the intersection of the 21-day and 100-day moving average indicators at $ 1,795. This level is a strong support and is expected to prevent further fall in gold prices.

۲۴ ارديبهشت ۰۰ ، ۱۷:۵۵
حمید راحت حق

Gold Trading Offer - Central Trading Tuesday, April 27

Gold Trading Offer - Central Trading Tuesday, April 27

https://s19.picofile.com/file/8431947876/centralgold_27_4_%D8%B1%D8%A7%D8%AD%D8%AA_%D8%AD%D9%82.png

Offer: Buy a deal above the point of 1773.00 with the first tick of 1789.00 and the second tick of 1796.00
Alternative offer (in case of price change) When the price falls below 1773.00, the price first starts moving towards 1768.00 and 1760.00.

Support and resistance points
1807.00
1796.00
1789.00
——
1773.00
1768.00
1760.00


More about gold ...

۰۷ ارديبهشت ۰۰ ، ۱۱:۰۱
حمید راحت حق

Weekly analysis of global gold news and ounce prices Sunday, April 25

Weekly analysis of global gold news and ounce prices Sunday, April 25

https://s18.picofile.com/file/8431764700/gold_forex_%D8%B1%D8%A7%D8%AD%D8%AA_%D8%AD%D9%82.jpg

The price of an ounce of world gold started a downward trend yesterday after hitting the price ceiling of $ 1,795, with a fall of 0.3 to the level of $ 1,778.

The most important reason for this decline is the 2% increase in the yield on US Treasury bonds to 1.567%.

Private-sector economic activity in the United States rose significantly in April from a month earlier, according to figures released by IHS Markit. However, part of the report noted that producers were concerned about Inflation is raising prices.

New home sales in the United States rose about 20.7% in March. Analysts, meanwhile, forecast growth of 12.8 percent.
Currently, the US dollar index is on a downward trend in the range of 91 units, and this could prevent further fall in gold prices.

Technical levels

Last price of the day: $ 1781.61
Daytime fluctuations: 2.51-
Daytime fluctuations (٪): 0.14-
Starting price: $ 1784.12

Trends

20-day moving average: $ 1744.16
50-day moving average: $ 1748.33
100-day moving average: $ 1804.1
200-day moving average: $ 1857.18

Levels

Yesterday's highest price: $ 1797.93
Lowest price yesterday: $ 1777.48
Last week's highest price: $ 1783.85
Last week's lowest price: $ 1723.8
Last month's highest price: $ 1759.98
Last month's lowest price: $ 1676.87
Fibonacci 38.2. Daily: $ 1785.29
Fibonacci 61.8. Daily: $ 1790.12

Pivot S1 Daily: $ 1775.09
Pivot S2 Daily: $ 1766.06
Pivot S3 Daily: $ 1754.64
Pivot R1 Daily: $ 1795.54
Pivot R2 Daily: $ 1806.96
Pivot R3 Daily: $ 1815.99

۰۵ ارديبهشت ۰۰ ، ۱۲:۱۶
حمید راحت حق