صفحه اصلی تقویم اقتصادی تحلیل رمزارزها (Cryptocurrency) تحلیل طلا (Gold) تحلیل فارکس (Forex) ارتباط با من درباره من
راحت__حق :: سایت تحلیل بورس، فارکس و ارز دیجیتال حمید راحت حق| Rahathagh.ir

اخبار و تحلیل نموداری و تکنیکالی بازارهای مالی دنیا اعم از بازار بورس داخلی، بازار فارکس، بازار طلا و بازار ارز دیجیتال و رمزارزها و روانشناسی بازار

۳ مطلب با کلمه‌ی کلیدی «راحت__حق» ثبت شده است

US Dollar Index (DXY) Analysis Thursday, April 1

US Dollar Index (DXY) Analysis Thursday, April 1

https://s17.picofile.com/file/8429298526/us_dollar_%D8%B1%D8%A7%D8%AD%D8%AA_%D8%AD%D9%82.jpg
The US dollar index is experiencing a corrective trend after reaching its highest annual level in the range of 93.4 to 93.5 units.
Although in the short term the trend is still bullish, but as we approach the buy saturation zone, there is a possibility that the index will fall to the level of the 200-day moving average indicator in the range of 92 units.
If the index can maintain its position above the level of the 200-day moving average indicator, then we can expect the index to grow in the short term.

Technical levels
Last level of the day: 93.13
Daily fluctuations: 34 pips
Daytime fluctuations (٪): 0.17-
Start: 93.29
Trends
20-day moving average: 92.06
50-day moving average: 91.17
100-day moving average: 91.05
200-day moving average: 92.53
Levels
Yesterday's highest level: 93.35
Yesterday's lowest level: 92.88
Last week's highest level: 92.92
Last week's lowest level: 91.71
Last month's highest level: 91.6
Last month's lowest level: 89.68
Fibonacci 38.2. Daily: 93.17
Fibonacci 61.8. Daily: 93.06
Pivot S1 Daily: 93
Pivot S2 Daily: 92.7
Pivot S3 Daily: 92.52
Pivot R1 Daily: 93.47
Pivot R2 Daily: 93.65
Pivot R3 Daily: 93.94

۱۲ فروردين ۰۰ ، ۱۰:۰۰
حمید راحت حق

An overview of the cryptocurrency market today Tuesday, February 16

An overview of the cryptocurrency market today Tuesday, February 16

https://bayanbox.ir/view/6021648321661948627/hit-16-2%D8%B1%D8%A7%D8%AD%D8%AA-%D8%AD%D9%82.jpg
Over the past 24 hours, we have seen a significant improvement in the cryptocurrency market after a slight correction that occurred yesterday morning. Bitcoin hit $ 50,000 for the first time, and the total cryptocurrency market capitalization rose to over $ 1.5 trillion.

Bitcoin touched the $ 50,000 level

For the first time in history, the market's top cryptocurrency touched the $ 50,000 target. Reaching this milestone, the price of bitcoin has grown by more than 72% since the beginning of 2021.

This happened after a few days of fluctuations in the price movements of this currency. On Sunday, Bitcoin seemed ready to break the $ 50,000 level. But during Asian trading, BTC experienced a slight correction and fell below $ 46,000.

Since then, the cryptocurrency has risen to less than $ 50,000 in less than a day.

Polkadat in fourth place

Meanwhile, according to CoinGecko, the Polkadat cryptocurrency (DOT) has officially become the fourth largest cryptocurrency in the market in terms of market value. The Altcoin surpassed Cardano to increase its distance from Tetra to $ 3 billion.

The total value of the crypto market has exceeded $ 1.5 trillion.

As can be seen in the map above, today the cryptocurrency market is a green hand. Atrium traded up about 2.5% at more than $ 1,800, DOT rose more than 14%, while ADA saw growth of 7.5%.

LightCoin is now approaching the $ 220 mark with a rise below 7%. XRP could not keep up with this wave and recorded only 0.55% growth.

In fact, the market situation today has been so favorable that Coin Market Cap data in the last 24 hours introduces only the VGX token with a 1.2% decrease as today's loser.

۲۸ بهمن ۹۹ ، ۱۸:۳۱
حمید راحت حق

What is the dollar index?

What is the dollar index?

https://bayanbox.ir/view/7969657076134980560/sophomore-usdx-components%D8%B1%D8%A7%D8%AD%D8%AA-%D8%AD%D9%82.jpg


The US dollar index consists of the geometric weight average of a basket of foreign currencies against the dollar. This is very similar to how stock indices work in that it provides an overview of the value of a portfolio of securities, the securities we are talking about here are other major currencies.
Basket

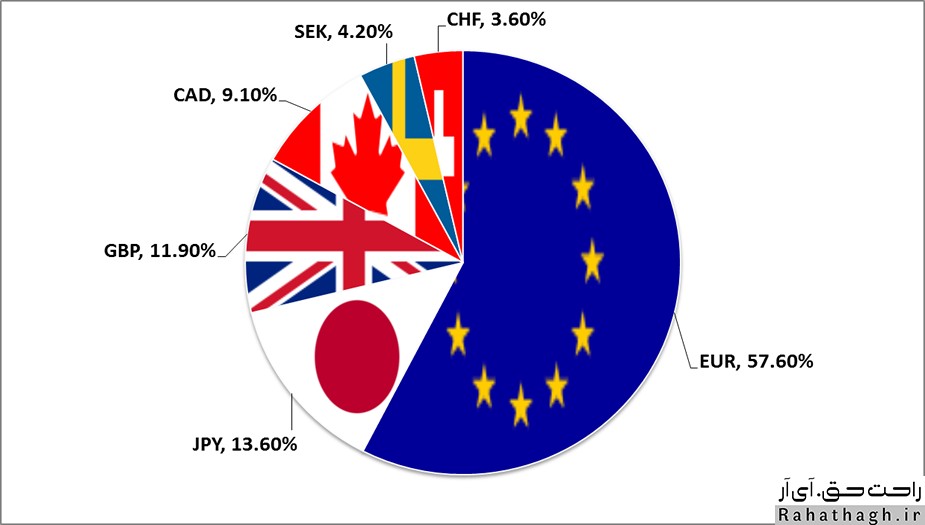
The US dollar index consists of six foreign currencies, which are:

    Euro (EUR)
    Yen (JPY)
    Pond GBP
    Canadian Dollars (CAD)
    Krone (SEK)
    Franc (CHF)

There is an interesting question here, if the index is created from 6 currencies, how many countries does it include?

If your answer is 6 you are wrong.

If your answer is 22 you are a genius.

There are 22 countries, as there are 17 EU members that have adopted the euro as their currency, plus five other countries (Japan, Britain, Canada, Sweden, Switzerland) and their associated currencies.

It is clear that 22 countries make up a small part of the world, but many other currencies follow the US dollar index very closely. This makes the USDX a good tool for measuring the global strength of the US dollar.
USDX Components

Now that we know what a portfolio consists of, let's get to the (geometric weight average) section. Since not all countries are the same size, it is fair to give each one a proper weight when calculating the US dollar index.

In 17 countries, the euro is a large part of the US dollar index. Next is the Japanese yen, which makes sense because Japan is one of the largest economies in the world. The other four countries make up less than 30% of the USDX.

Here's something interesting: When the euro falls, which one might cause the US dollar index to move?

The euro is also a large part of the US dollar index, we can call this index (anti-euro index). Since the USDX is strongly influenced by the Euro, people are looking for the dollar index (they are the most balanced). More information is provided below, first let's look at the charts!

Use USDX in Forex

How do you probably think I can use the dollar index in my trading system? Well be patient, we all know that many highly traded currency pairs include the US dollar, such as EUR / USD. USD / JPY. USD / CHF. GBP / USD. USD.CAD, in fact, often USDX provides a better picture when the market outlook for the US dollar is unclear. In the wider world of Forex, the USDX can be used as an indicator of the strength of the US dollar, since the USDX is more than 50% formed by the euro area and is quite inversely related to the EUR / USD.
This is like a mirror image! If one goes up the other is likely to go down. If the USDX is making significant moves, you can almost certainly expect currency traders to react to it. In short, currency traders use the USDX as a key indicator for the direction of the USD. use.

۱۱ بهمن ۹۹ ، ۱۴:۵۱
حمید راحت حق