صفحه اصلی تقویم اقتصادی تحلیل رمزارزها (Cryptocurrency) تحلیل طلا (Gold) تحلیل فارکس (Forex) ارتباط با من درباره من
راحت حق! :: سایت تحلیل بورس، فارکس و ارز دیجیتال حمید راحت حق| Rahathagh.ir

اخبار و تحلیل نموداری و تکنیکالی بازارهای مالی دنیا اعم از بازار بورس داخلی، بازار فارکس، بازار طلا و بازار ارز دیجیتال و رمزارزها و روانشناسی بازار

۱۹ مطلب با کلمه‌ی کلیدی «راحت حق!» ثبت شده است

Cardano Analysis (ADA) Tuesday, April 13

Cardano Analysis (ADA) Tuesday, April 13

https://uupload.ir/files/jtrw_cardano-physical-coin-%D8%B1%D8%A7%D8%AD%D8%AA-%D8%AD%D9%82.jpg

The price of Cardano digital currency has increased by about 10% in the last 48 hours. Due to the 12-hour time frame, an important level of resistance has prevented price growth. In the last month, the price has hit this level several times but has not been able to cross it.
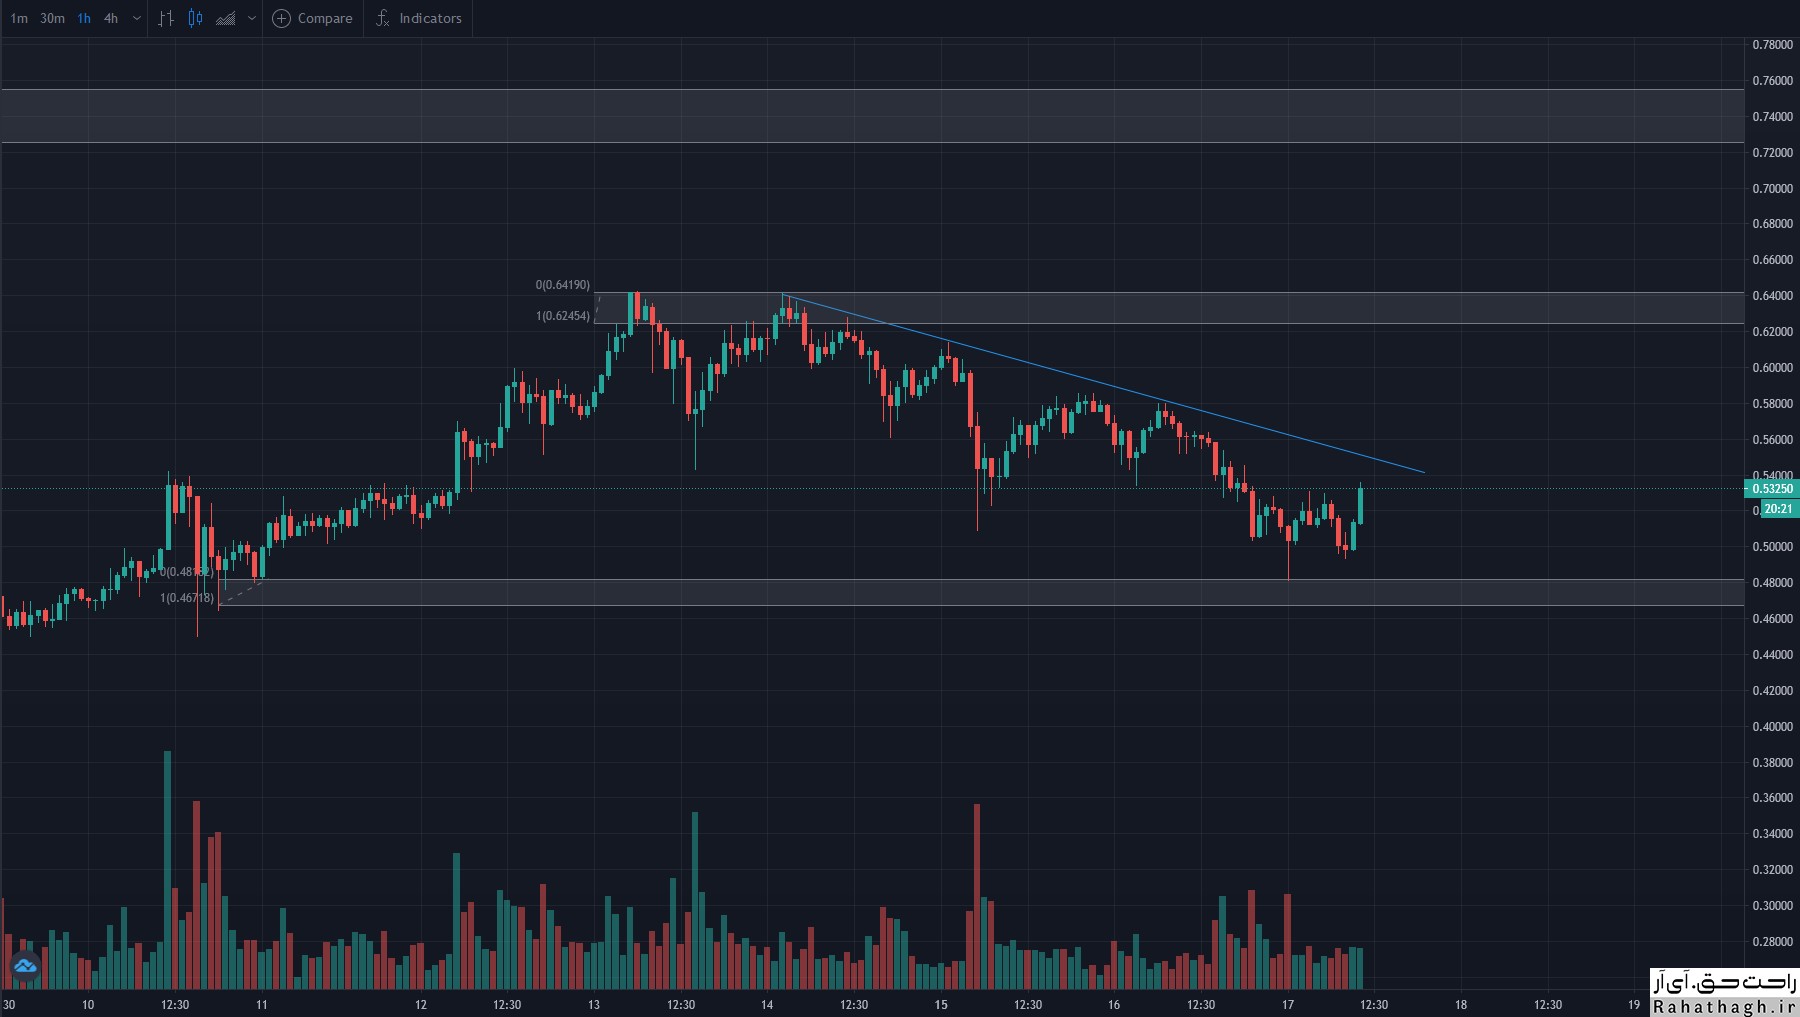
Looking at the 12-hour timeframe, we notice the formation of an ascending triangle pattern. This pattern consists of an uptrend line and a horizontal trend line.

The resistance level of this pattern is in the range of $ 1.35. The price is currently fluctuating in the range of $ 1,317 and is only 2.% away from this level. If Cardano can cross this resistance level, then one can expect a price increase of up to $ 1.647.
However, a significant resistance has formed at $ 1.47 and the price has hit it twice in the last month.

If the resistance does not break $ 1.35, the price will fall to the uptrend line at $ 1.24. Next, if the price penetrates below the level of this pattern, we will see a 22% drop to $ 0.96. In this way, $ 1.15 and $ 1.04 levels will play a supporting role.

۲۴ فروردين ۰۰ ، ۱۸:۴۰
حمید راحت حق

Apple Stock Performance Review (AAPL) Saturday, April 10

Apple Stock Performance Review (AAPL) Saturday, April 10

https://bayanbox.ir/view/961194449563302501/apple-%D8%B1%D8%A7%D8%AD%D8%AA-%D8%AD%D9%82.jpg

Shares of Apple Corps (NASDAQ: AAPL) closed up 2.02% at $ 133 on the last trading day. The overall stock market experienced an uptrend on the last day, with the Nasdaq Composite Index rising 0.51% to 13,900.19 and the Dow Jones Industrial Average (DJIA) up 0.89% to 33%. ٫ 800.60 units increased. Yesterday marked the seventh consecutive day of profits for Apple shares. On the other hand, Apple shares closed $ 12.10 lower than their last 52-week high of $ 145.09, which was recorded on January 25.

Let's compare the performance of some of Apple's competitors. Microsoft Shares (MSFT), for example, rose 1.03% to $ 255.85. Shares of Alphabet (GOOGL) rose 0.9 percent to $ 2,270.67 and IBM rose 0.02 percent to $ 135.73.
Apple shares traded up $ 105.2 million, well above their 50-day moving average of $ 104.4 million.

۲۱ فروردين ۰۰ ، ۱۱:۲۳
حمید راحت حق

Ripple increased the total value of the crypto market to $ 2 trillion

Ripple increased the total value of the crypto market to $ 2 trillion

https://s17.picofile.com/file/8429776676/Ripplexrp_%D8%B1%D8%A7%D8%AD%D8%AA_%D8%AD%D9%82.jpg

Ripple Digital Currency (XRP) has finally been able to compete with other digital currencies. Yesterday, the currency grew by more than 38% and reached $ 0.87, the highest level since May 6, 2018.

Although most exchanges canceled or stopped XRP trading in the United States due to legal issues, the currency has grown 280 percent since last year, just 14 percent away from touching $ 1.

According to CoinMarketCap, Ripple has now overtaken Cardano and is the sixth largest digital currency in terms of market value. Due to the XRP rally, the total value of the digital currency market has crossed $ 2 trillion for the first time.

۱۷ فروردين ۰۰ ، ۰۸:۵۳
حمید راحت حق

Bitcoin Analysis Sunday, April 4

Bitcoin Analysis Sunday, April 4

https://s16.picofile.com/file/8429575268/bitcoin_%D8%B1%D8%A7%D8%AD%D8%AA_%D8%AD%D9%82.jpg
Last week, the price of Bitcoin surpassed $ 55,500 with a steady rise. The BTC / USD pair also broke the $ 58,000 resistance and was higher than the simple moving average of 100 (4 hours).

The pair even crossed the $ 59,500 level and continued its upward trend above the $ 60,000 resistance. However, the price did not close above the $ 60,000 level, but the price ceiling was set at around $ 60,030, after which a new downward trend began. In this downtrend, the support levels of $ 58,500 and $ 58,000 were broken.

The price of Bitcoin fell below the correction level of 23.6% Fibonacci retracement of the volatile price of $ 50,465 fell to the price level of $ 60,630. The BTC / USD 4-hour chart also shows a price break below a bullish uptrend line with support near $ 59,000.

The pair touched the $ 56500 support area and the simple moving average of 100 (4 hours). In addition, another uptrend line has formed with support at nearly $ 56,800 in the same chart.

If below the trend line support, the level of $ 56,500 and the simple moving average of 100 (4 hours) we see a downward price break, there is a possibility of a sudden fall to $ 55,250. This level is close to the 50% Fibonacci retracement level of the $ 50,465 uptrend to $ 60,630. Any further reductions may touch the $ 53,800 level.

If Bitcoin can stay above the $ 56500 support and the simple moving average of 100 (4 hours), it will probably face a price increase again.

The first major resistance to bitcoin is nearing $ 58,000. Closing the price above the $ 58,000 level could pave the way for a move to the 60,000 resistance area. The next major hurdle is close to $ 62,000.

Technical indicators

The MACD is accelerating hourly for the BTC / USD pair in the downtrend area.

The hourly RSI for the BTC / USD pair is currently below the 50 level.

Main Support: $ 56500

Main resistors: $ 58,000

۱۵ فروردين ۰۰ ، ۱۲:۰۶
حمید راحت حق

Gold Analysis Thursday, March 25

Gold Analysis Thursday, March 25

https://s17.picofile.com/file/8428783792/gold_%D8%B1%D8%A7%D8%AD%D8%AA_%D8%AD%D9%82.jpg
The price of the global ounce of gold fluctuated around $ 1,735 at the beginning of Thursday and has not yet managed to cross the $ 5 range. The price is currently fluctuating within the indicator of the 200-hour moving average and is nearing the end of the symmetrical triangle pattern.
Given the low volatility trend of the RSI indicator, one can expect the price to move only if the resistance of $ 1,738 or support of $ 1,725 ​​is broken. On the other hand, the 78.6% Fibonacci level at $ 1,720 and the monthly price ceiling at $ 1,755 play the role of support and resistance levels, respectively.
If the price fails to maintain the corrective trend at the beginning of March and the US dollar index grows, then sellers will be able to control the market for a longer period of time.

Technical levels
Last price of the day: $ 1734.48
Daytime fluctuations: 0.48-
Daytime fluctuations (٪): 0.03-
Starting price: $ 1734.96
Trends
20-day moving average: $ 1726.26
50-day moving average: $ 1787.01
100-day moving average: $ 1826.41
200-day moving average: $ 1860.65
Levels
Yesterday's highest price: $ 1738.48
Yesterday's lowest price: $ 1723.86
Last week's highest price: $ 1755.59
Last week's lowest price: $ 1719.3
Last month's highest price: $ 1871.9
Last month's lowest price: $ 1717.24
Fibonacci 38.2. Daily: $ 1732.9
Fibonacci 61.8. Daily: $ 1729.44
Pivot S1 Daily: $ 1726.39
Pivot S2 Daily: $ 1717.81
Pivot S3 Daily: $ 1711.77
Pivot R1 Daily: $ 1741.01
Pivot R2 Daily: $ 1747.05
Pivot R3 Daily: $ 1755.63

۰۵ فروردين ۰۰ ، ۱۳:۳۴
حمید راحت حق

Dogecoin Analysis (DOGE) Wednesday, March 4

Dogecoin Analysis (DOGE) Wednesday, March 4

https://bayanbox.ir/view/555681595720775864/1-%D8%B1%D8%A7%D8%AD%D8%AA-%D8%AD%D9%82.jpeg
Following the fall of the Dogecoin digital currency this month, buyers are trying to form a corrective trend. However, we are seeing a slight volatility in the Dogecoin price.
On the other hand, by drawing two trend lines in a four-hour time frame, a regular triangle pattern is formed. If this pattern is broken from any side, an ascending or descending trend will be formed.
If the pattern breaks, the Dodge Quinn will rise 38% to $ 0.07. However, buyers should be able to push the price above the levels of the 100 and 200 moving average indicators in the four-hour time frame.

Another factor that has increased the probability of price growth is the uptrend of the MACD indicator. According to this indicator, the MACD line has reached the top of the signal line. This triggered a buy signal by the MACD.
On the other hand, the number of new daily addresses that are added to the network of this digital currency has now reached 42,000 after reaching 33,000 on February 23rd. The growth and expansion of the Dogecoin network is an important fundamental factor for price growth.

On the other hand, looking at the four-hour time frame, we see that the 50 moving average indicator in the range of $ 0.05 plays the role of a support. If the price penetrates below the level of this indicator, the price will fall to the downtrend line of the triangle pattern, and if this level is broken, we will see a strong downtrend to the target of $ 0.03.

۱۳ اسفند ۹۹ ، ۲۱:۴۰
حمید راحت حق

An overview of the cryptocurrency market Wednesday, March 3

An overview of the cryptocurrency market Wednesday, March 3

https://bayanbox.ir/view/4173917620424987606/crypto3-3-%D8%B1%D8%A7%D8%AD%D8%AA-%D8%AD%D9%82.jpg
Following a sharp drop that pushed the price of Bitcoin to $ 47,000, the currency traded back at $ 50,000. The Altcoins market is also mostly green today.

Bitcoin crossed the $ 50,000 resistance

After a sharp drop last week that brought Bitcoin below $ 43,000, the currency is slowly showing positive reactions as a new path opens up for the cows.

As reported yesterday, Bitcoin even broke the $ 50,000 level for a short time but could not maintain its momentum. The rejection of the price caused the currency to fall again and fall to the level of $ 47,000 (in Bitstamp).

Since then, Bitcoin has returned to this level once again, rising by about $ 3,000 to about $ 50,000. At the time of writing, Bitcoin is trading at $ 51477.

Technical indicators of the currency show that this particular price level is the first major resistance line in the uptrend of Bitcoin, so that BTC can cross the resistance levels of $ 52,500 and $ 55,000 after crossing this level.

If the price is rejected again, the support levels of $ 47,200, $ 46,600 and $ 44,750 can help.

Atrium reached $ 1,600

Most altcoins also saw unfavorable price movements last week, but were revisited in the last few days. Atrium, which has fallen to $ 1,300, has jumped nearly $ 300 since then and is now close to $ 1,600.

Cardano's 2% increase helped ADA remain third in the market value of digital assets. BinanceQueen (1%) and Ripple (2.5%) are also green in 24-hour timeframes. China Link has increased its value by 6% since yesterday and is currently priced above $ 30. The Polkadat also jumped 6.5 percent to trade at $ 38.

Nevertheless, Light Coin showed the most significant growth among the top ten currencies with a 12% increase. As a result, LTC is approaching the $ 200 mark.

Among the low and medium market value altcoins, the Energy Web Token had the best performance with 32% growth and reaching the $ 18 level. Ocean Protocol (22%), NEM (19%), Basic Attention Token (19%), Enjin Coin (18%), Phantom (13%), Decentraland (12%) and Ontology (11%) are next. they take.

Finally, the total cryptocurrency market capitalization remains above $ 1.5 trillion.

۱۳ اسفند ۹۹ ، ۱۴:۱۶
حمید راحت حق

Ripple Analysis (XRP) Wednesday, February 17

Ripple Analysis (XRP)

https://bayanbox.ir/view/134946101484175358/ripple-%D8%B1%D8%A7%D8%AD%D8%AA-%D8%AD%D9%82.jpg
The price of Ripple Digital Currency is currently fluctuating in the range of $ 0.53302. The MACD and RSI indicators have also shown a downward trend.
However, the price continued its uptrend yesterday from the support range of $ 0.4880 to $ 0.4840. This level is the intersection of the 100 moving average indicator in the four-hour time frame and the downtrend line formed since February 2 (February 4) until now.
Currently, the 50-day moving average indicator level at $ 0.5460 and the Sunday bearish trend line at $ 0.56 play the resistance levels.
If the resistance breaks $ 0.56, the price will rise to the monthly downward trend line at $ 0.06150.
On the other hand, if the price penetrates below the support level of $ 0.4880 to $ 0.4840, one can expect the price to fall to $ 0.4 and the lowest monthly level at $ 0.3405.

Technical levels
Last price of the day: $ 0.5122
Daily fluctuations: 77- Pip
Fluctuations of the day (٪): 1.48-
Starting price: $ 0.5199
Trends
20-day moving average: $ 0.4632
50-day moving average: $ 0.3473
100-day moving average: $ 0.406
200-day moving average: $ 0.333
Levels
Yesterday's highest price: $ 0.58.03
Yesterday's lowest price: $ 0.4819
Last week's highest price: $ 0.6247
Last week's lowest price: $ 0.3911
Last month's highest price: $ 0.5167
Last month's lowest price: $ 0.2109
Fibonacci 38.2. Daily: $ 0.5195
Fibonacci 61.8. Daily: $ 0.5427
Pivot S1 Daily: $ 0.4745
Pivot S2 Daily: $ 0.429
Pivot S3 Daily: $ 0.3761
Pivot R1 Daily: $ 0.5728
Pivot R2 daily: $ 0.6258
Pivot R3 Daily: $ 0.6712


Hamid Rahathagh

۲۹ بهمن ۹۹ ، ۱۱:۱۳
حمید راحت حق

Economic calendar Monday, February 1

Economic calendar Monday, February 1

  https://bayanbox.ir/view/8401434621478652150/eco2-1%D8%B1%D8%A7%D8%AD%D8%AA-%D8%AD%D9%82.jpg

۱۳ بهمن ۹۹ ، ۱۱:۲۹
حمید راحت حق