صفحه اصلی تقویم اقتصادی تحلیل رمزارزها (Cryptocurrency) تحلیل طلا (Gold) تحلیل فارکس (Forex) ارتباط با من درباره من
تحلیل بیت کوین :: سایت تحلیل بورس، فارکس و ارز دیجیتال حمید راحت حق| Rahathagh.ir

اخبار و تحلیل نموداری و تکنیکالی بازارهای مالی دنیا اعم از بازار بورس داخلی، بازار فارکس، بازار طلا و بازار ارز دیجیتال و رمزارزها و روانشناسی بازار

۵ مطلب با کلمه‌ی کلیدی «تحلیل بیت کوین» ثبت شده است

آیا روند نزولی [بیت کوین] به پایان رسیده است؟ + تحلیل بیت کوین

نشانه‌هایی از رسیدن بیت کوین به کف‌ های قیمتی دیده می شود، آیا روند نزولی به پایان رسیده است؟


bitcoin-راحت-حق-buy.jpg (1441×958)

یکی از شاخص‌های درون ‌زنجیره‌ای قابل ‌اعتماد بیت کوین، نشان می‌دهد که ممکن است روند نزولی حال حاضر به پایان خود رسیده شده باشد. حرکتی که در آن بیت کوین در طول دو ماه ۴۰ درصد از ارزش خود را از دست بدهد.

به گزارش کوین دسک، شاخص رکود تعدیل ‌شده (Entity Adjusted Dormancy) معیاری است برای اندازه‌ گیری نسبت ارزش کل بیت کوین‌های موجود در چرخه بازار به واحدهایی که برای یک سال دست‌ نخورده باقی مانده‌اند. از این شاخص برای سنجش آن دسته از رفتارهای بازار استفاده می ‌شود که به خروج جریان پول ختم می‌شوند.

شاخص رکود تعدیل‌ شده اکنون به زیر ۲۵۰,۰۰۰ دلار رسیده است. همان طور که از نمودار زیر پیداست، این سطح در گذشته در دوره‌های رسیدن قیمت به کف‌های اصلی نمایان شده است.


bitcoin-راحت-حق-reverse.jpg (1800×1013)


نرخ رکود تعدیل ‌شده هم اکنون به کف رسیده که نشان ‌دهنده بازنشانی کامل این شاخص است. گلسنود هم در گزارش دو روز پیش خود تأیید کرده بود که این اتفاق معمولاً در پایان چرخه‌های قیمتی رخ می‌دهد.

گلسنود گفته است:

پایین ‌بودن نرخ رکود تعدیل ‌شده به این معنی است که نسبت ارزش بازار به ارزش واحدهایی که یک سال است دست‌ نخورده باقی مانده‌اند، پایین‌تر از حد معمول است؛ این یعنی می‌توان گفت بیت کوین ارزش خرید دارد.

ارزش کل بازار بیت کوین حاصل‌ ضرب تعداد تمام واحدهای استخراج‌ شده در قیمت لحظه‌ای هر واحد بیت کوین است. در حال حاضر ارزش بازار بیت کوین ۸۰۹.۹۸ میلیارد دلار است.


bitcoin-راحت-حق-sell.jpg (1523×861)

قیمت بیت کوین در تیر سال 1400 به کف رسیده بود و پس از آنکه این شاخص وارد ناحیه سبزرنگ شد، یک روند صعودی تازه در بازار آغاز شد و قیمت به اوج تاریخی ۶۹,۰۰۰ دلاری رسید.

در حالی که این شاخص مجدداً صعودی شده است، عوامل کلان می‌توانند این چشم‌ انداز را تحت‌ تأثیر قرار دهند.


bitcoin-راحت-حق-analysis.jpg (1722×595)

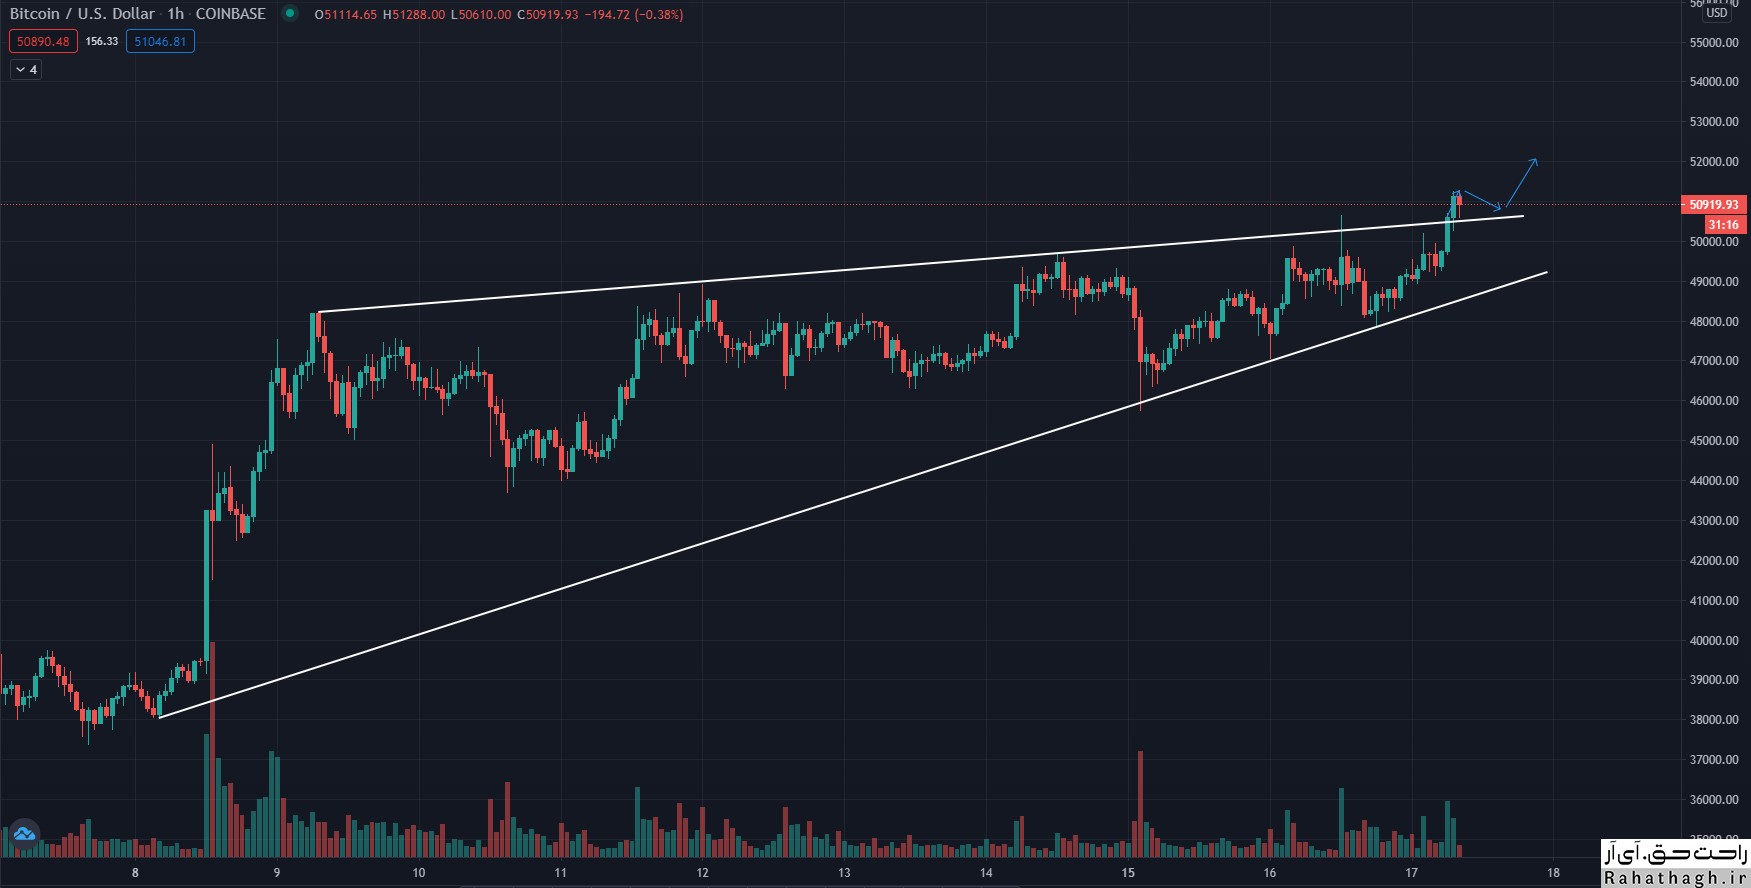
در نمودار بیت کوین دیده می شود که قیمت به محدوده حمایتی خط روند کشیده شده قرار دارد. و با توجه به این شاخص باید دید که آیا می تواند نقاط مقاومتی پیش رو رد کند یا خیر.

۲۲ دی ۰۰ ، ۱۹:۱۸
حمید راحت حق

قیمت *بیت کوین به زیر 32هزار رسید اما هنوز |خریداران وارد عمل نشده اند & + تحلیل بیت کوین

قیمت *بیت کوین به زیر 32هزار رسید اما هنوز |خریداران وارد عمل نشده اند & + تحلیل بیت کوین

https://bayanbox.ir/view/9221313159599007799/bitcoin-analysis-%D8%B1%D8%A7%D8%AD%D8%AA-%D8%AD%D9%82.jpg

بیت کوین در طی ساعات گذشته به زیر 32هزار دلار سقوط کرده اما این سقوط باعث نشده که خریداران در بازار حضور پیدا کنند و به علت عدم فشار خرید، قیمت بیت کوین (Bitcoin) کم کم به محدوده 31هزار 900 دلار رسیده است.

با توجه به اینکه اکثر آلت کوین ها نیز پیرو سرگروه خود یعنی بیت کوین هستند، در پی این کاهش قیمت در بیت کوین، بسیاری از آلت کوین ها نیز با سقوط قیمتی همراه بودند. شاید بتوان فروش هیجانی را یکی از دلایل این افت قیمت ها در نظر گرفت.


تحلیل قیمتی بیت کوین (Bitcoin)

بیت کوین در ساعات اخیر دچار فشار فروش شده و به محدوده حمایتی رسیده است. همانطور که در تصویر مشاهده می شود این محدوده حمایتی در صورت اینکه خریداران وارد بازار شوند می تواند باعث برگشت قیمتی گردیده و در غیر این صورت باعث ریزش بیشتر تا محدوده 30 هزار و سپس 28هزار دلار می گردد.


حمایت اصلی بیت کوین محدوده 30هزاردلار

مقاومت اصلی بیت کوین محدوده 32هزار دلار

۲۳ تیر ۰۰ ، ۱۲:۰۴
حمید راحت حق

Bitcoin Analysis Sunday, April 4

Bitcoin Analysis Sunday, April 4

https://s16.picofile.com/file/8429575268/bitcoin_%D8%B1%D8%A7%D8%AD%D8%AA_%D8%AD%D9%82.jpg
Last week, the price of Bitcoin surpassed $ 55,500 with a steady rise. The BTC / USD pair also broke the $ 58,000 resistance and was higher than the simple moving average of 100 (4 hours).

The pair even crossed the $ 59,500 level and continued its upward trend above the $ 60,000 resistance. However, the price did not close above the $ 60,000 level, but the price ceiling was set at around $ 60,030, after which a new downward trend began. In this downtrend, the support levels of $ 58,500 and $ 58,000 were broken.

The price of Bitcoin fell below the correction level of 23.6% Fibonacci retracement of the volatile price of $ 50,465 fell to the price level of $ 60,630. The BTC / USD 4-hour chart also shows a price break below a bullish uptrend line with support near $ 59,000.

The pair touched the $ 56500 support area and the simple moving average of 100 (4 hours). In addition, another uptrend line has formed with support at nearly $ 56,800 in the same chart.

If below the trend line support, the level of $ 56,500 and the simple moving average of 100 (4 hours) we see a downward price break, there is a possibility of a sudden fall to $ 55,250. This level is close to the 50% Fibonacci retracement level of the $ 50,465 uptrend to $ 60,630. Any further reductions may touch the $ 53,800 level.

If Bitcoin can stay above the $ 56500 support and the simple moving average of 100 (4 hours), it will probably face a price increase again.

The first major resistance to bitcoin is nearing $ 58,000. Closing the price above the $ 58,000 level could pave the way for a move to the 60,000 resistance area. The next major hurdle is close to $ 62,000.

Technical indicators

The MACD is accelerating hourly for the BTC / USD pair in the downtrend area.

The hourly RSI for the BTC / USD pair is currently below the 50 level.

Main Support: $ 56500

Main resistors: $ 58,000

۱۵ فروردين ۰۰ ، ۱۲:۰۶
حمید راحت حق

Bitcoin Analysis Thursday, March 25

Bitcoin Analysis Thursday, March 25

https://s17.picofile.com/file/8428782592/what_is_bitcoin_cryptocurrency_001.jpg
Yesterday, Bitcoin was able to reach levels above $ 55,500 and $ 56,000 with the start of a proper recovery process. BTC even crossed the $ 57,000 resistance and the simple moving average of 100 (hourly).

However, the currency failed to continue its uptrend further, and as a result, resumed its downward trend after forming a price ceiling at $ 57,235. In the hourly chart of the BTC / USD pair, a price break is seen below a major uptrend line with support near $ 54,220.

The price of Bitcoin fell even below the support level of $ 54,000 and the pivot level of $ 53,200. Following this downward trend, the weekly price floor formed around the level of $ 51634 and bitcoin entered the consolidation phase. The first resistance is near the level of $ 53,000, which is near the correction level of 23.6% Fibonacci, the downward trend of $ 57,235 to $ 51634.

The first major resistance to this market cryptocurrency is near the $ 53,200 pivot level. If we see the price rise again above the $ 53,200 level, the probability of reaching the $ 54500 level increases. The 50% Fibonacci retracement level is down from $ 57,235 to $ 51634 and close to $ 54500.

If the bitcoin correction trend does not lead to levels above $ 53,200 and $ 545,500, in the short term it is more likely to continue its downward trend. In this case, the first support will be close to the level of $ 51,500.

The first major support is now close to the $ 51,000 level, below which the $ 50,000 support area is likely to be touched. Any further price cuts could lead to a move to the $ 48,000 level.

Technical indicators

The hourly MACD for the BTC / USD pair is slowly accelerating in the downtrend.

The hourly RSI for the BTC / USD pair is now below the 40 level.

Main support: $ 51,000 and $ 50,000

Main resistances: 53200, 54500 and 55000 dollars

۰۵ فروردين ۰۰ ، ۱۳:۱۵
حمید راحت حق

Bitcoin Analysis (BTC) Wednesday, February 17

Bitcoin Analysis (BTC) Wednesday, February 17

https://bayanbox.ir/view/5541391780580057507/BTC-%D8%B1%D8%A7%D8%AD%D8%AA-%D8%AD%D9%82.jpg
Bitcoin prices regained their uptrend and broke the $ 50,000 resistance. BTC is maintaining a profit and seems to be moving further towards 52000.

Expand profitability

The price of bitcoin finally managed to cross the $ 50,000 resistance area. BTC climbed above the $ 50,200 and $ 50,500 levels and traded at the new $ 50,600 level before correcting the downtrend. There was a Sharpe correction below the $ 50,000 level. The price even fell below the $ 49,000 support level. However, the cows were able to stay close to the $ 48,000 area and the simple 100-hour moving average. A floor formed near the level of $ 47,819 and the price is currently rising.

Bitcoin above the Fibonacci retracement level trades 50% down from the $ 50,000 to $ 47,819. There was also a break above the key contraction triangle with resistance near 49,500 on the BTC / USD chart.
 The price trades well above $ 50,000 and is completely above the simple moving average of 100 hours and is testing the Fibonacci retracement level of 76.4% downward from the $ 50,000 swing ceiling to the $ 47,819 floor.

It seems that the upward trend of the price towards the ceiling of $ 50,600 will continue. A further climb could easily push the price towards the 51000 level. The next key resistance is at $ 52,000.

BTC fall again?

If Bitcoin fails to stay above the $ 50,000 and $ 50,200 levels, a bearish correction will occur. Initial support is near the $ 49,500 level and the broken triangle trend line.

A break below $ 49,500 could push the price towards $ 48,000 support. The simple 100-hour moving average is also set to support close to $ 48,000.

 Technical indicators:

Indicator of moving average convergence Hourly divergence in the cattle area.

The hourly relative strength index is currently above the 50 level.

Main support levels: $ 49,500 and then $ 49,000.

Main resistance levels: $ 50,000, $ 51,000 and $ 52,000.

۲۹ بهمن ۹۹ ، ۱۲:۰۲
حمید راحت حق