
Bitcoin Analysis (BTC) Wednesday, February 17
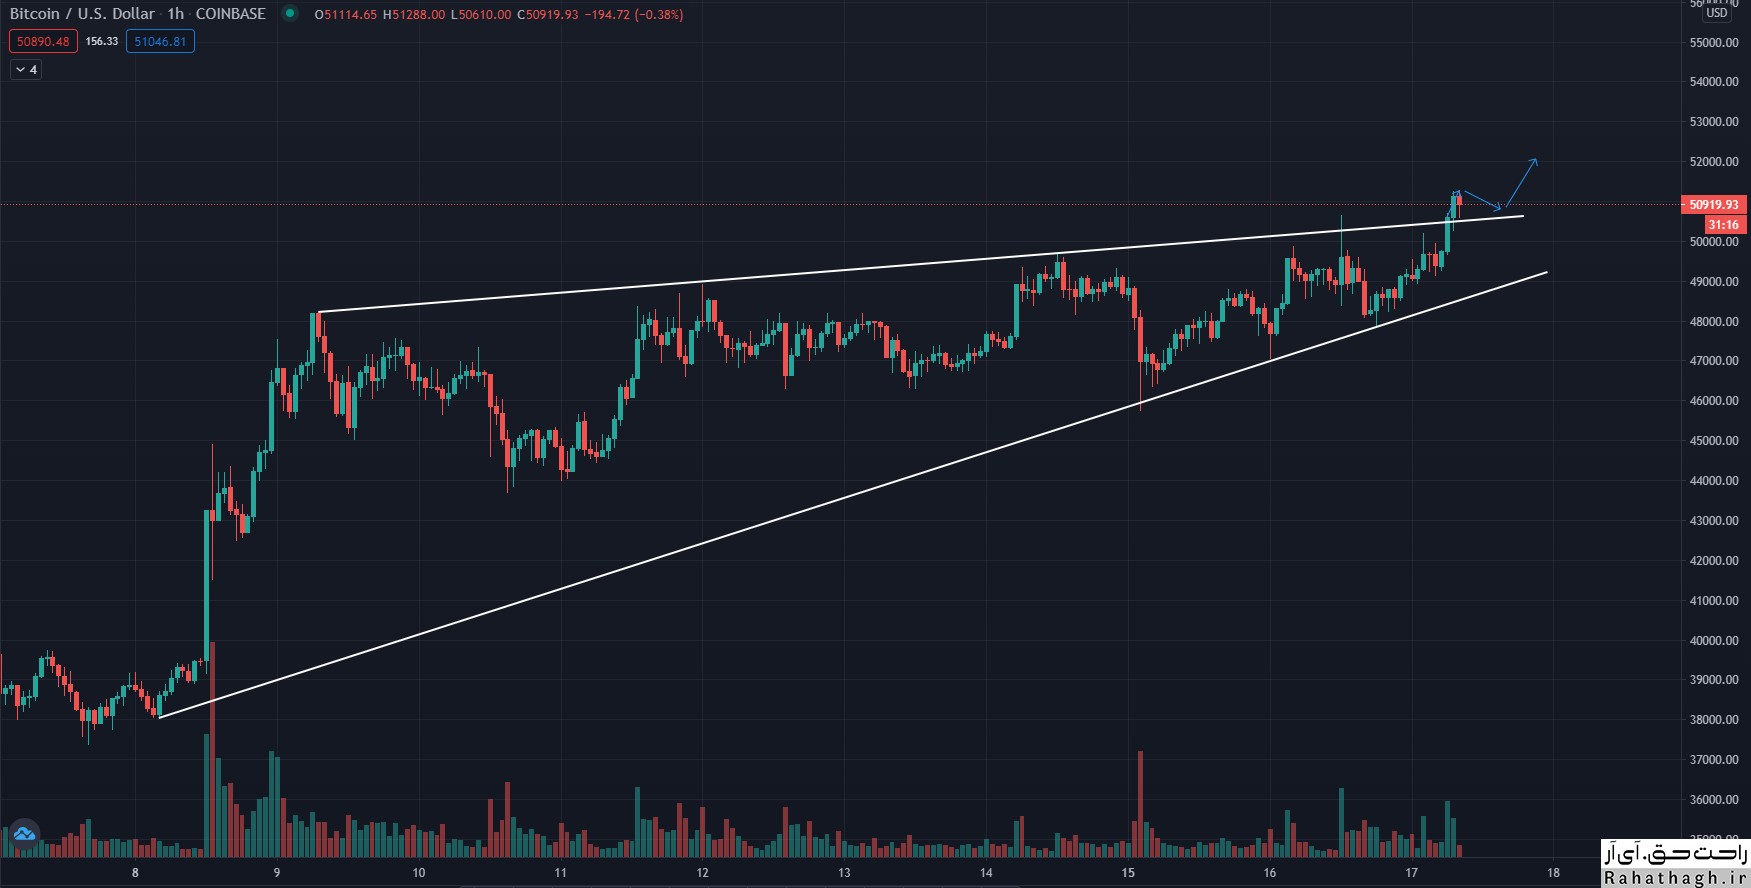
Bitcoin prices regained their uptrend and broke the $ 50,000 resistance. BTC is maintaining a profit and seems to be moving further towards 52000.
Expand profitability
The price of bitcoin finally managed to cross the $ 50,000 resistance area. BTC climbed above the $ 50,200 and $ 50,500 levels and traded at the new $ 50,600 level before correcting the downtrend. There was a Sharpe correction below the $ 50,000 level. The price even fell below the $ 49,000 support level. However, the cows were able to stay close to the $ 48,000 area and the simple 100-hour moving average. A floor formed near the level of $ 47,819 and the price is currently rising.
Bitcoin above the Fibonacci retracement level trades 50% down from the $ 50,000 to $ 47,819. There was also a break above the key contraction triangle with resistance near 49,500 on the BTC / USD chart.
The price trades well above $ 50,000 and is completely above the simple moving average of 100 hours and is testing the Fibonacci retracement level of 76.4% downward from the $ 50,000 swing ceiling to the $ 47,819 floor.
It seems that the upward trend of the price towards the ceiling of $ 50,600 will continue. A further climb could easily push the price towards the 51000 level. The next key resistance is at $ 52,000.
BTC fall again?
If Bitcoin fails to stay above the $ 50,000 and $ 50,200 levels, a bearish correction will occur. Initial support is near the $ 49,500 level and the broken triangle trend line.
A break below $ 49,500 could push the price towards $ 48,000 support. The simple 100-hour moving average is also set to support close to $ 48,000.
Technical indicators:
Indicator of moving average convergence Hourly divergence in the cattle area.
The hourly relative strength index is currently above the 50 level.
Main support levels: $ 49,500 and then $ 49,000.
Main resistance levels: $ 50,000, $ 51,000 and $ 52,000.
