An overview of the cryptocurrency market today Tuesday, April 20

Bitcoin falls to 54 thousand dollars
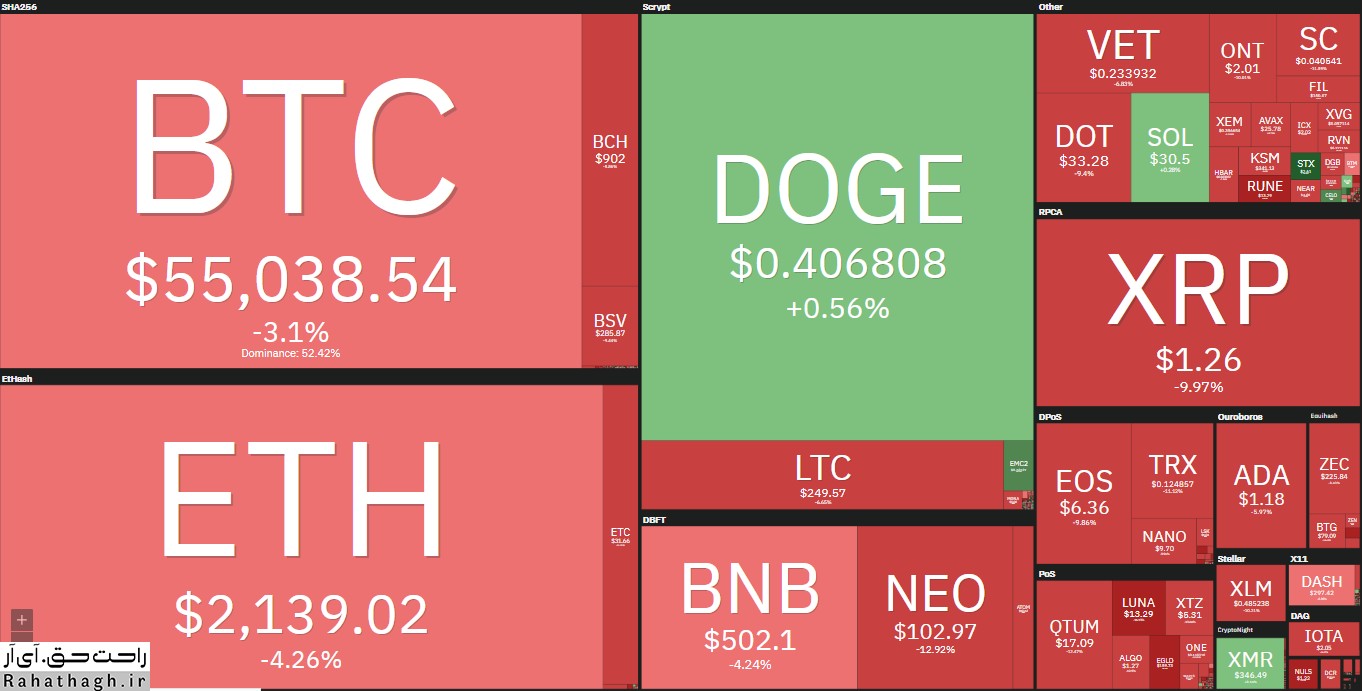
As previously reported, the market's first cryptocurrency has recently experienced a sharp drop in price. The asset lost about $ 9,000 in value in a matter of hours, reaching its lowest level in three weeks at $ 51,500.
Within 24 hours, the currency was able to offset more than $ 6,000 in losses. This led to yesterday's highest figure above $ 57,500. However, the situation was reversed once again and the BTC plummeted.
The cryptocurrency has since lost more than $ 3,500 in value and is currently trading below $ 54,000. In addition, its market value has once again fallen below $ 1 trillion. This means that BTC has lost its key support level at 50 DMA. Lark Davis, an analyst and commentator on cryptocurrencies, estimates that the average is about 12 days.
Increasing market fluctuations have also caused more losses for traders. Bybt data show that more than $ 1.3 billion has been liquidated in the last 24 hours.
Technical indicators show that if bitcoin continues to fall freely, $ 51440 and $ 50,000 support lines will help the currency. If this trend is reversed, the asset should overcome resistance levels of $ 55,400, $ 56,280 and $ 58,355.
Dodge Quinn jumps in the bloody market today
Most replacement coins have followed in the footsteps of their leader in recent days, but their situation today is somewhat worse than BTC.
Atrium fell more than 7 percent on a 24-hour scale, falling below $ 2,100. Binance Quinn (6-%) has also fallen below $ 500. Ripple (-16%), Cardano (-10%), Polkadot (-13%), Litecoin (-10%), Bitcoin Cash (-13%), Uniswap (-8%) and Chainlink (-12%) today They are red.
Dodge Quinn has been able to continue its impressive performance today amid a massive drop in prices among the market altcoins, growing by 20% in 24-hour timeframes and by 455% in a one-week period, now reaching $ 0.40. As a result of these developments, DOGE has become the fifth largest cryptocurrency in terms of market value.
The situation among lower market value altcoins has fluctuated sharply today. For example, Helium has experienced a 22% drop in 24-hour timeframe. Nano (-20%), Kusama (-20%), Harmony (-17%), 0x (-17%), IOST (-17%), IOTA (-17%), OMG Network (-16%), Bitcoin Gold (-16%), Tezos (-15%) and Algorand (-15%) have also lost significant value.
Finally, the value of the cryptocurrency market has fallen below $ 2 trillion in one day by more than $ 150 billion.

