صفحه اصلی تقویم اقتصادی تحلیل رمزارزها (Cryptocurrency) تحلیل طلا (Gold) تحلیل فارکس (Forex) ارتباط با من درباره من
بازار رمز ارز :: سایت تحلیل بورس، فارکس و ارز دیجیتال حمید راحت حق| Rahathagh.ir

اخبار و تحلیل نموداری و تکنیکالی بازارهای مالی دنیا اعم از بازار بورس داخلی، بازار فارکس، بازار طلا و بازار ارز دیجیتال و رمزارزها و روانشناسی بازار

۵ مطلب با کلمه‌ی کلیدی «بازار رمز ارز» ثبت شده است

An overview of the cryptocurrency market today Tuesday, April 20

An overview of the cryptocurrency market today Tuesday, April 20

https://s19.picofile.com/file/8431322768/crypto_20_4_%D8%B1%D8%A7%D8%AD%D8%AA_%D8%AD%D9%82.jpg

Bitcoin falls to 54 thousand dollars

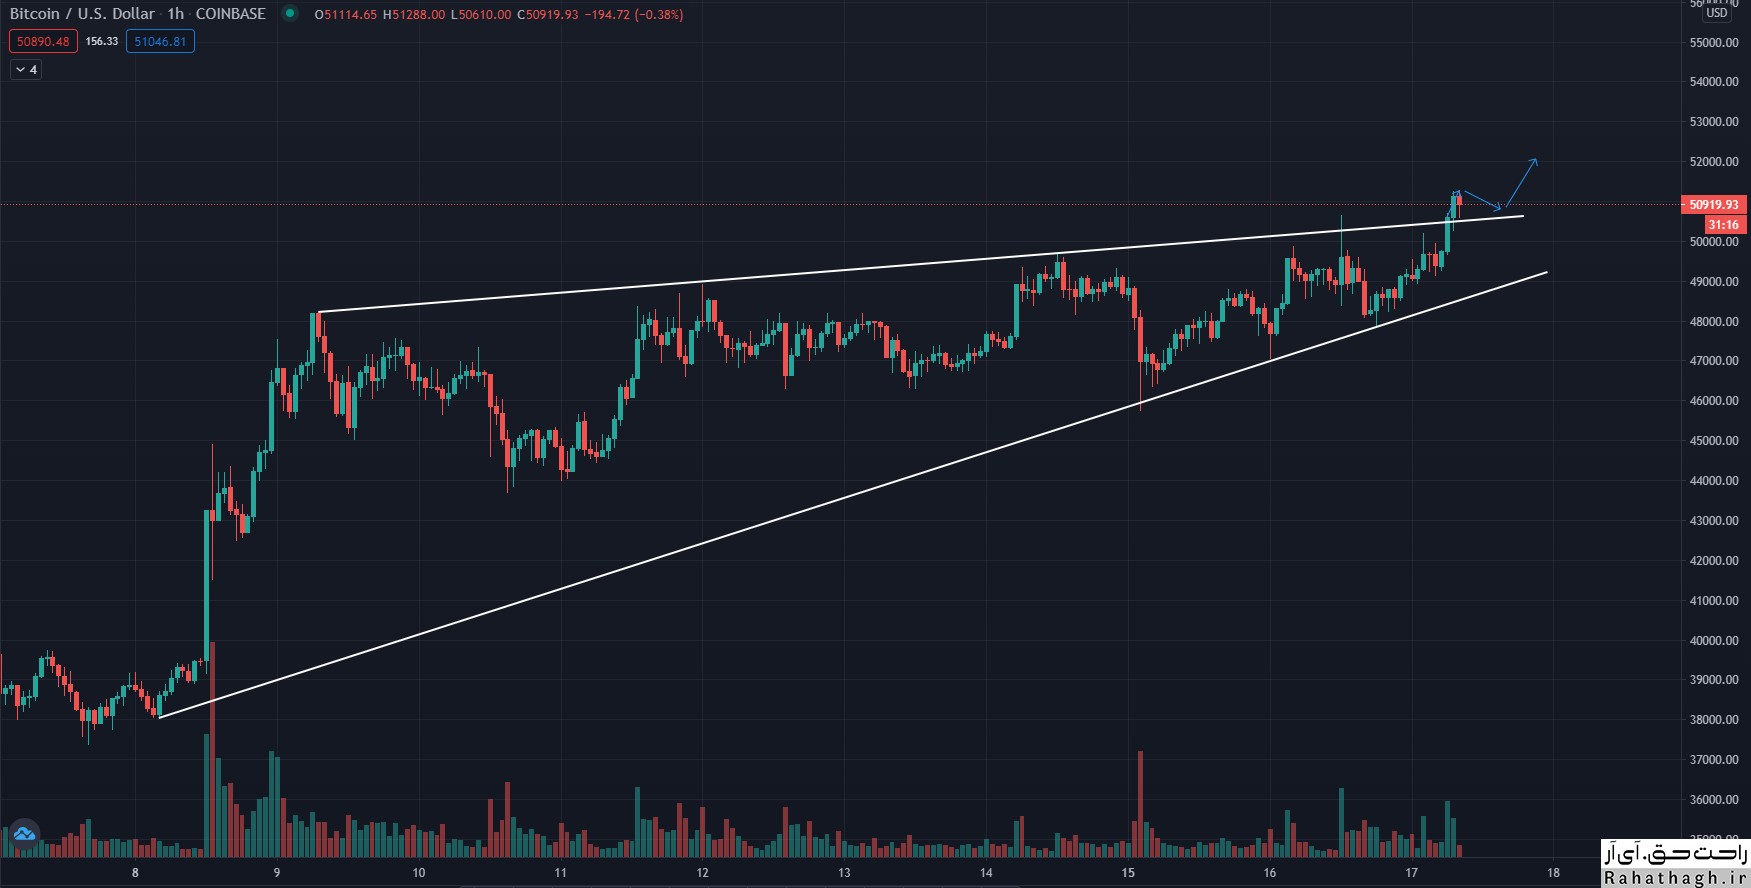
As previously reported, the market's first cryptocurrency has recently experienced a sharp drop in price. The asset lost about $ 9,000 in value in a matter of hours, reaching its lowest level in three weeks at $ 51,500.

Within 24 hours, the currency was able to offset more than $ 6,000 in losses. This led to yesterday's highest figure above $ 57,500. However, the situation was reversed once again and the BTC plummeted.

The cryptocurrency has since lost more than $ 3,500 in value and is currently trading below $ 54,000. In addition, its market value has once again fallen below $ 1 trillion. This means that BTC has lost its key support level at 50 DMA. Lark Davis, an analyst and commentator on cryptocurrencies, estimates that the average is about 12 days.

Increasing market fluctuations have also caused more losses for traders. Bybt data show that more than $ 1.3 billion has been liquidated in the last 24 hours.

Technical indicators show that if bitcoin continues to fall freely, $ 51440 and $ 50,000 support lines will help the currency. If this trend is reversed, the asset should overcome resistance levels of $ 55,400, $ 56,280 and $ 58,355.

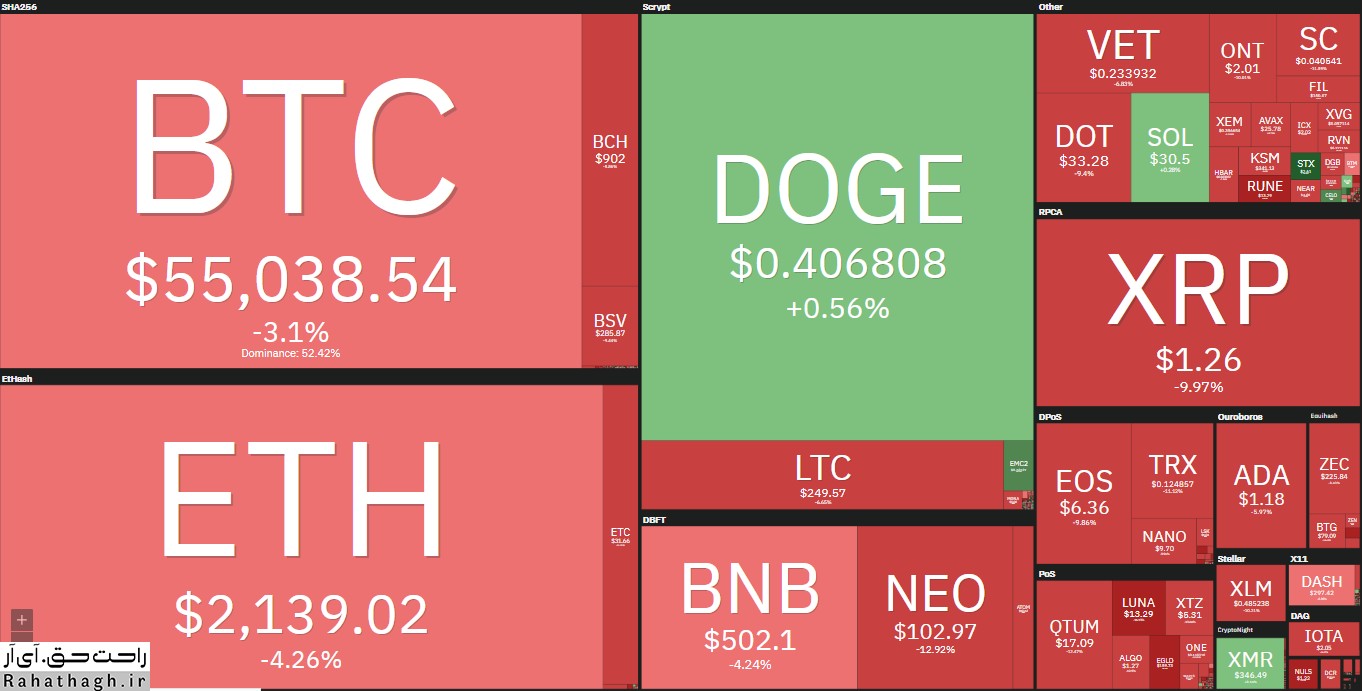
Dodge Quinn jumps in the bloody market today

Most replacement coins have followed in the footsteps of their leader in recent days, but their situation today is somewhat worse than BTC.

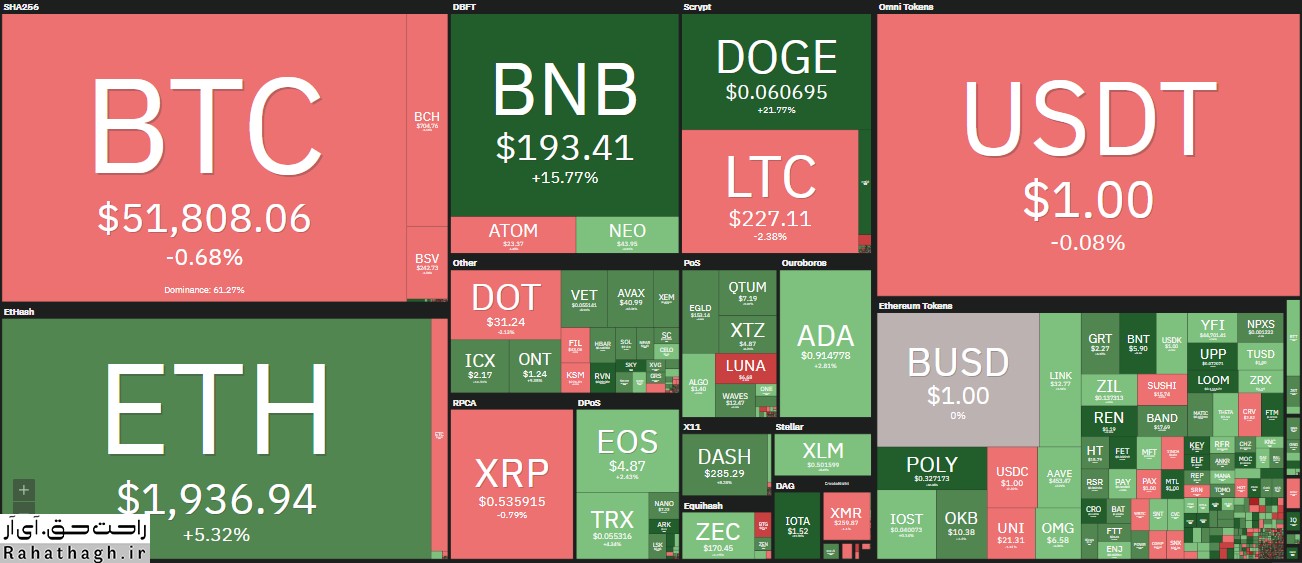
Atrium fell more than 7 percent on a 24-hour scale, falling below $ 2,100. Binance Quinn (6-%) has also fallen below $ 500. Ripple (-16%), Cardano (-10%), Polkadot (-13%), Litecoin (-10%), Bitcoin Cash (-13%), Uniswap (-8%) and Chainlink (-12%) today They are red.


Dodge Quinn has been able to continue its impressive performance today amid a massive drop in prices among the market altcoins, growing by 20% in 24-hour timeframes and by 455% in a one-week period, now reaching $ 0.40. As a result of these developments, DOGE has become the fifth largest cryptocurrency in terms of market value.

The situation among lower market value altcoins has fluctuated sharply today. For example, Helium has experienced a 22% drop in 24-hour timeframe. Nano (-20%), Kusama (-20%), Harmony (-17%), 0x (-17%), IOST (-17%), IOTA (-17%), OMG Network (-16%), Bitcoin Gold (-16%), Tezos (-15%) and Algorand (-15%) have also lost significant value.

Finally, the value of the cryptocurrency market has fallen below $ 2 trillion in one day by more than $ 150 billion.

۳۱ فروردين ۰۰ ، ۱۳:۵۵
حمید راحت حق

Stellar Analysis (XLM) Monday, April 19

Stellar Analysis (XLM) Monday, April 19

https://s18.picofile.com/file/8431207700/stellar_19_4_%D8%B1%D8%A7%D8%AD%D8%AA_%D8%AD%D9%82.jpg

The price of Stellar Digital Currency has been fluctuating within the range of an uptrend channel for five months.


The price has been in the range of an uptrend channel in daily timeframe since the end of November 2020, and now with the price hitting the bottom trend line of this channel during the recent fall, there is a possibility of an uptrend and price correction.


The recent drop in prices caused the Stellar market value to fall by 27%. However, as prices fall below the uptrend channel, we see new activity from buyers.


The last two times the price has hit the bottom of this channel, we have seen an upward trend. Currently, one can expect the price to rise to $ 1.42 in the range of 127.2% Fibonacci.


However, investors must first wait for the price to react to the 50-day moving average indicator. It is also important to break the resistance level of $ 0.58 to $ 0.69 to form an uptrend.


On the other hand, if the price penetrates below the bottom trend line of the uptrend channel at $ 0.40, the probability of a fall in price increases.
In this case, you can expect a 13% drop to $ 0.34.

۳۰ فروردين ۰۰ ، ۱۰:۱۴
حمید راحت حق

Chiliz Analysis (CHZ) Wednesday, April 14

Chiliz Analysis (CHZ) Wednesday, April 14

https://uupload.ir/files/nfb8_chiliz-%D8%B1%D8%A7%D8%AD%D8%AA-%D8%AD%D9%82.jpg

The price of Chiliz is currently trading above the $ 0.5 price level inside a continuous bull pattern known as the bull bullion (bullish). Such technical formation caused a jump in the market value of Chiliz and the creation of a flagpole pattern.
This process continued slowly, leading to the creation of a sloping, downward canal.

The decisive closing of the price above the upper border of the flag with the price of $ 0.523 announced the beginning of a 94% bullish (bullish) rally. By adding the height of the flagpole to the breaking point of the upper boundary, the $ 1.01 target is reached.

If traders can not restrain the Chilean uptrend, the currency could rise to the Fibonacci level of 127.2% at $ 1.61.

According to the IOMAP chart, it will not be easy to continue the uptrend because cows have a difficult path ahead of the currency traders.

Over 12,400 addresses bought 946 million Chiliz for $ 0.49 to $ 0.53. Everyone wants to sell. So any new trade in the short term may hit the opposite target because some investors want to lower prices.
Therefore, reversal by any of these price levels in this range may reduce the chill to support areas.

If sellers bring the price of Chiliz below $ 0.39, the downtrend will be key, as it indicates a move below the flag pattern.

If this scenario continues, Chiliz could initially drop 13% to $ 0.345, the first support level. Otherwise, the cryptocurrency will move to the level of 61.8% Fibonacci at $ 0.24.

۲۵ فروردين ۰۰ ، ۱۹:۳۰
حمید راحت حق

An overview of the cryptocurrency market Friday, February 19

An overview of the cryptocurrency market  Friday, February 19

https://bayanbox.ir/view/5477792946733890155/bit%D8%B1%D8%A7%D8%AD%D8%AA-%D8%AD%D9%82.jpg
Over the past 24 hours, we have seen new records being recorded among cryptocurrencies. Bitcoin climbed above $ 52,500 with Atrium and Bainance Coin breaking new records.
A new record for Bitcoin

The currency resumed its uptrend after Bitcoin fell to $ 46,000 on Monday. As reported in the early days of this week, BTC entered the $ 50,000 channel for the first time and has not fallen significantly since. In the last 24 hours, Bitcoin reached its last record at $ 52,600 (on Bitstamp), entering the $ 52,000 area, and continued to rise.

With this record, BTC was only $ 20 billion away from reaching a market value of $ 1 billion. However, after a slight increase yesterday, with the addition of altcoins to this uptrend, bitcoin dominance has once again decreased to 61%.

New records for other altcoins

As mentioned above, most of the replacement coins in the last 24 hours were in line with the upward trend in the market. Atrium is leading the way with a 6% increase. Binance Quinn also reached above $ 180 with its record breaking again. This asset has increased in price by about 350% since January 27 (February 28).

Polkadot (3%), Cardano (10%), Ripple (4%), Litecoin (6%) and Bitcoin Cash (1.5%) are also among the top 10 currencies in the market today.

The situation has been similarly high among lower market value altcoins. Bancor (40%), Venus (34%), Horizen (33%), PancakeSwap (33%), Phantom (26%) and Polygon (25%) are in the double-digit currency group.

Naturally, this overall price increase also means setting a new record in the total value of the crypto market. The market value of all encrypted assets approached $ 1.6 trillion. The index has risen more than $ 700 billion since mid-January.

۰۱ اسفند ۹۹ ، ۰۲:۲۶
حمید راحت حق

Bitcoin Analysis (BTC) Wednesday, February 17

Bitcoin Analysis (BTC) Wednesday, February 17

https://bayanbox.ir/view/5541391780580057507/BTC-%D8%B1%D8%A7%D8%AD%D8%AA-%D8%AD%D9%82.jpg
Bitcoin prices regained their uptrend and broke the $ 50,000 resistance. BTC is maintaining a profit and seems to be moving further towards 52000.

Expand profitability

The price of bitcoin finally managed to cross the $ 50,000 resistance area. BTC climbed above the $ 50,200 and $ 50,500 levels and traded at the new $ 50,600 level before correcting the downtrend. There was a Sharpe correction below the $ 50,000 level. The price even fell below the $ 49,000 support level. However, the cows were able to stay close to the $ 48,000 area and the simple 100-hour moving average. A floor formed near the level of $ 47,819 and the price is currently rising.

Bitcoin above the Fibonacci retracement level trades 50% down from the $ 50,000 to $ 47,819. There was also a break above the key contraction triangle with resistance near 49,500 on the BTC / USD chart.
 The price trades well above $ 50,000 and is completely above the simple moving average of 100 hours and is testing the Fibonacci retracement level of 76.4% downward from the $ 50,000 swing ceiling to the $ 47,819 floor.

It seems that the upward trend of the price towards the ceiling of $ 50,600 will continue. A further climb could easily push the price towards the 51000 level. The next key resistance is at $ 52,000.

BTC fall again?

If Bitcoin fails to stay above the $ 50,000 and $ 50,200 levels, a bearish correction will occur. Initial support is near the $ 49,500 level and the broken triangle trend line.

A break below $ 49,500 could push the price towards $ 48,000 support. The simple 100-hour moving average is also set to support close to $ 48,000.

 Technical indicators:

Indicator of moving average convergence Hourly divergence in the cattle area.

The hourly relative strength index is currently above the 50 level.

Main support levels: $ 49,500 and then $ 49,000.

Main resistance levels: $ 50,000, $ 51,000 and $ 52,000.

۲۹ بهمن ۹۹ ، ۱۲:۰۲
حمید راحت حق