صفحه اصلی تقویم اقتصادی تحلیل رمزارزها (Cryptocurrency) تحلیل طلا (Gold) تحلیل فارکس (Forex) ارتباط با من درباره من
انالیز طلای جهانی :: سایت تحلیل بورس، فارکس و ارز دیجیتال حمید راحت حق| Rahathagh.ir

اخبار و تحلیل نموداری و تکنیکالی بازارهای مالی دنیا اعم از بازار بورس داخلی، بازار فارکس، بازار طلا و بازار ارز دیجیتال و رمزارزها و روانشناسی بازار

۴ مطلب با کلمه‌ی کلیدی «انالیز طلای جهانی» ثبت شده است

Weekly analysis of global gold news and ounce prices Sunday, April 25

Weekly analysis of global gold news and ounce prices Sunday, April 25

https://s18.picofile.com/file/8431764700/gold_forex_%D8%B1%D8%A7%D8%AD%D8%AA_%D8%AD%D9%82.jpg

The price of an ounce of world gold started a downward trend yesterday after hitting the price ceiling of $ 1,795, with a fall of 0.3 to the level of $ 1,778.

The most important reason for this decline is the 2% increase in the yield on US Treasury bonds to 1.567%.

Private-sector economic activity in the United States rose significantly in April from a month earlier, according to figures released by IHS Markit. However, part of the report noted that producers were concerned about Inflation is raising prices.

New home sales in the United States rose about 20.7% in March. Analysts, meanwhile, forecast growth of 12.8 percent.
Currently, the US dollar index is on a downward trend in the range of 91 units, and this could prevent further fall in gold prices.
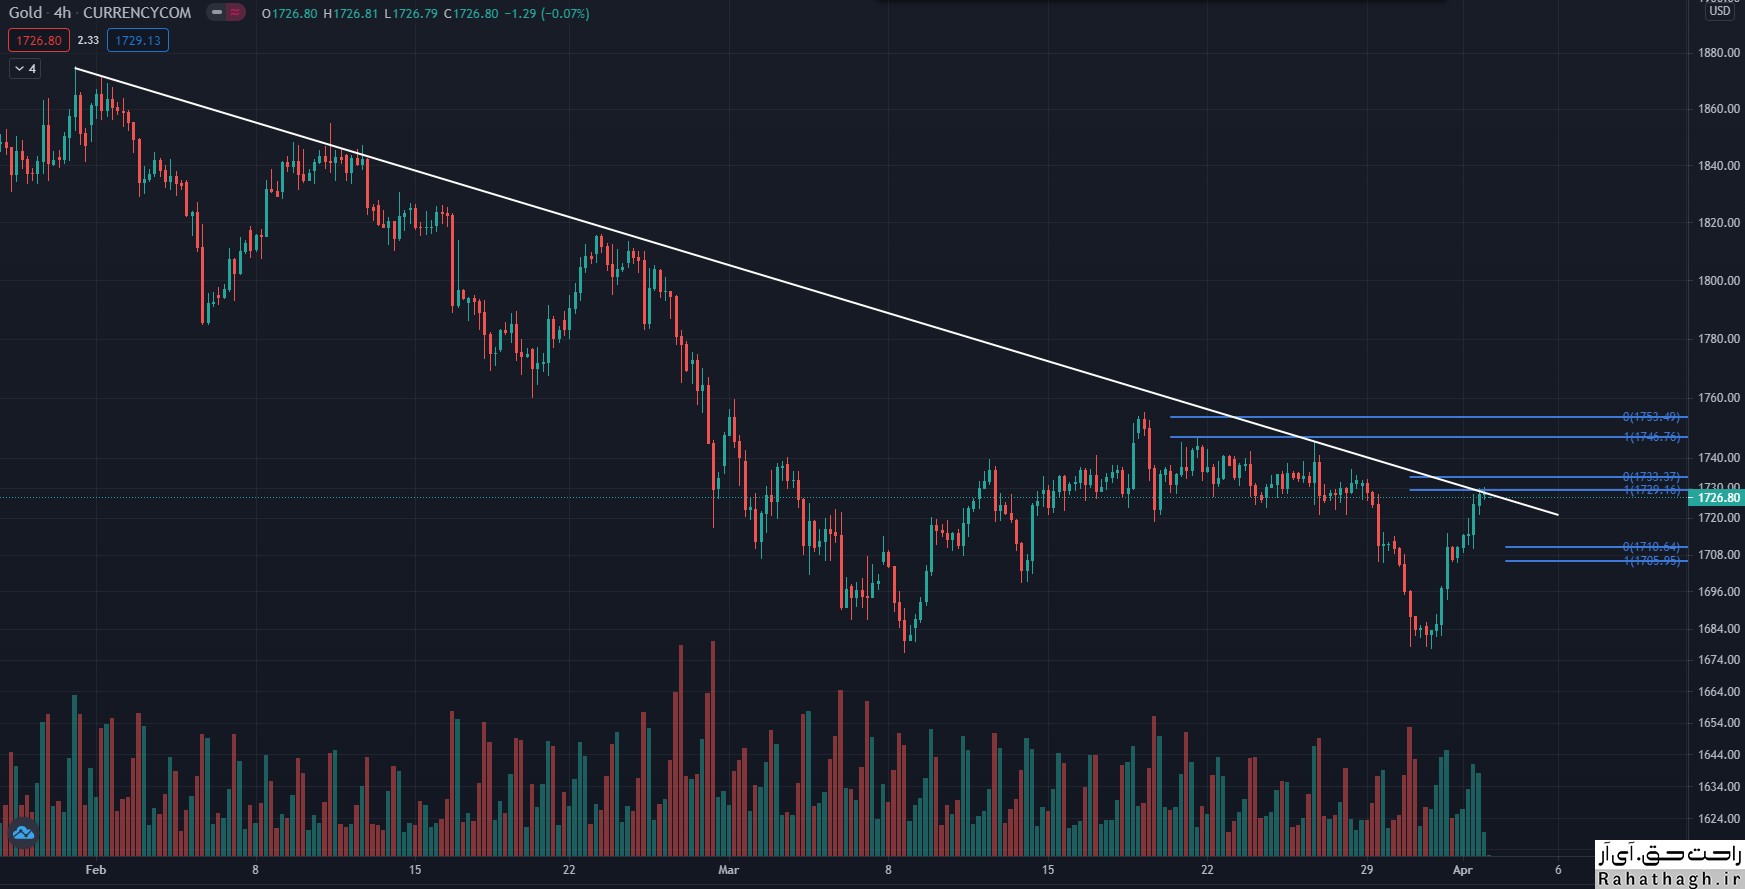
Technical levels

Last price of the day: $ 1781.61
Daytime fluctuations: 2.51-
Daytime fluctuations (٪): 0.14-
Starting price: $ 1784.12

Trends

20-day moving average: $ 1744.16
50-day moving average: $ 1748.33
100-day moving average: $ 1804.1
200-day moving average: $ 1857.18

Levels

Yesterday's highest price: $ 1797.93
Lowest price yesterday: $ 1777.48
Last week's highest price: $ 1783.85
Last week's lowest price: $ 1723.8
Last month's highest price: $ 1759.98
Last month's lowest price: $ 1676.87
Fibonacci 38.2. Daily: $ 1785.29
Fibonacci 61.8. Daily: $ 1790.12

Pivot S1 Daily: $ 1775.09
Pivot S2 Daily: $ 1766.06
Pivot S3 Daily: $ 1754.64
Pivot R1 Daily: $ 1795.54
Pivot R2 Daily: $ 1806.96
Pivot R3 Daily: $ 1815.99

۰۵ ارديبهشت ۰۰ ، ۱۲:۱۶
حمید راحت حق

Weekly Gold Analysis Saturday, April 3

Weekly Gold Analysis Saturday, April 3

https://s17.picofile.com/file/8429459934/gold_4_3_%D8%B1%D8%A7%D8%AD%D8%AA_%D8%AD%D9%82.jpg
The price of gold has been on the rise despite the growth of employment in the United States. In March, the United States, the world's largest economy, created 916,000 jobs. If inflation continues, will the Fed raise interest rates and reduce the attractiveness of gold for investment? The answer to this question is complicated! But first, gold must be examined technically.
According to the TCI indicator, a significant support level is formed at $ 1,738. This level is the intersection of the middle band of the Bollinger Band indicator in a four-hour time frame with levels of 23.6% weekly Fibonacci and 61.8% monthly Fibonacci.
If this support level is broken, the next target will be the level of $ 1,708. In this range, the 100-hour moving average indicator and the weekly S2 pivot hit a level of 38.2% Fibonacci monthly.

On the other hand, the first resistance level is formed at $ 1,732 (the intersection of the upper band of the Bollinger Band indicator and the level of 38.2% Fibonacci weekly).
If this resistance level is broken, the next target will be the $ 1,747 level. This resistance is formed at the intersection of the daily P2 R2 and the weekly R1.

۱۴ فروردين ۰۰ ، ۱۱:۰۴
حمید راحت حق

Return of gold ounces from key support

Return of gold ounces from key support

https://bayanbox.ir/view/7270866199690193010/ImageDetail-%D8%B1%D8%A7%D8%AD%D8%AA-%D8%AD%D9%82.jpg

On November 30, 2020, the global ounce of gold, after hitting $ 1764, started moving up to the price of $ 1959.36. Gold traders entered the market around this rate, which resulted in the beginning of a new downtrend. Recently, gold ounce price movements have been restricted between the two downtrend lines. In today's trading, the market is again supported by the price of $ 1708.64 and the price of gold has risen. If the market continues to return positively from $ 1708.6 and the ounce of gold breaks the downtrend line, one can expect the market to move to the rate of $ 1742.21, the moving average of 50 and the resistance of $ 1767.
But if the ounce of gold definitively breaks the 1708.64-1700 range, it could start a new downtrend to support at $ 1675 and then $ 1650.

۱۴ اسفند ۹۹ ، ۲۲:۲۴
حمید راحت حق

Technical analysis of the global gold ounce Tuesday, March 2

Technical analysis of the global gold ounce Tuesday, March 2

https://bayanbox.ir/view/6752005902692352902/%D8%B1%D8%A7%D8%AD%D8%AA-%D8%AD%D9%82-gold.jpg
The price of an ounce of global gold on Tuesday continued its downward trend for the fourth consecutive day after the increase in demand and the growth of the US dollar index.
The price of gold is currently affected by the trend of the dollar index and the rate of return of treasury bonds in the absence of important economic news.
Due to the four-hour time frame, the price of gold is breaking the downside channel. If a four-hour candle closes below the support level of the trend line at $ 1,712, we can expect the price to fall to the bottom of 2020, ie $ 1,671.
If this support level is not broken, the price will rise to the level of the moving average indicator 21 in the four-hour time frame, ie $ 1,755.

۱۲ اسفند ۹۹ ، ۲۳:۱۵
حمید راحت حق