Atrium Analysis (ETH) Wednesday, March 10

Ethereum is currently on an upward trajectory. The currency was able to overcome the resistance of $ 1850. This Ethereum (ETH) traded at its highest monthly price close to the level of $ 1880 and was just above the simple moving average of 100 (hourly).
Recently, ether started a slight downtrend and traded below the support level of $ 1825. At some point, the price of ether below the correction level of 23.6% Fibonacci broke the uptrend of $ 1649 to $ 1882. Ethereum is now trading below $ 1,800, but is still above the 100-hour moving average.
Ethereum is now testing the $ 1,765 support area. The ETH / USD's hourly chart also shows a major uptrend line with support around $ 1775. The trend line is close to the 50% Fibonacci retracement level of $ 1649 to $ 1882.
In the uptrend, the $ 1800 level is a short-term resistance. The first major resistance is near the $ 1825 level. A break above $ 1825 and $ 1850 could pave the way for the $ 1880 and $ 1900 levels.
If Ethereum fails to continue its uptrend above the $ 1800 and $ 1825 resistance levels, it is likely to face a downtrend. In this case, the first major support near the trend line is at $ 1865.
Currently, the main support is forming near the level of $ 1725 and the simple moving average of 100 (hourly). If the price falls below $ 1725 support, ether may fall to the level of $ 1650.
Technical indicators
The hourly MACD for the ETH / USD pair is gradually accelerating in the downtrend.
The hourly RSI for the ETH / USD pair is below the 50 level.
Main Support: $ 1725
Main resistance: $ 1825
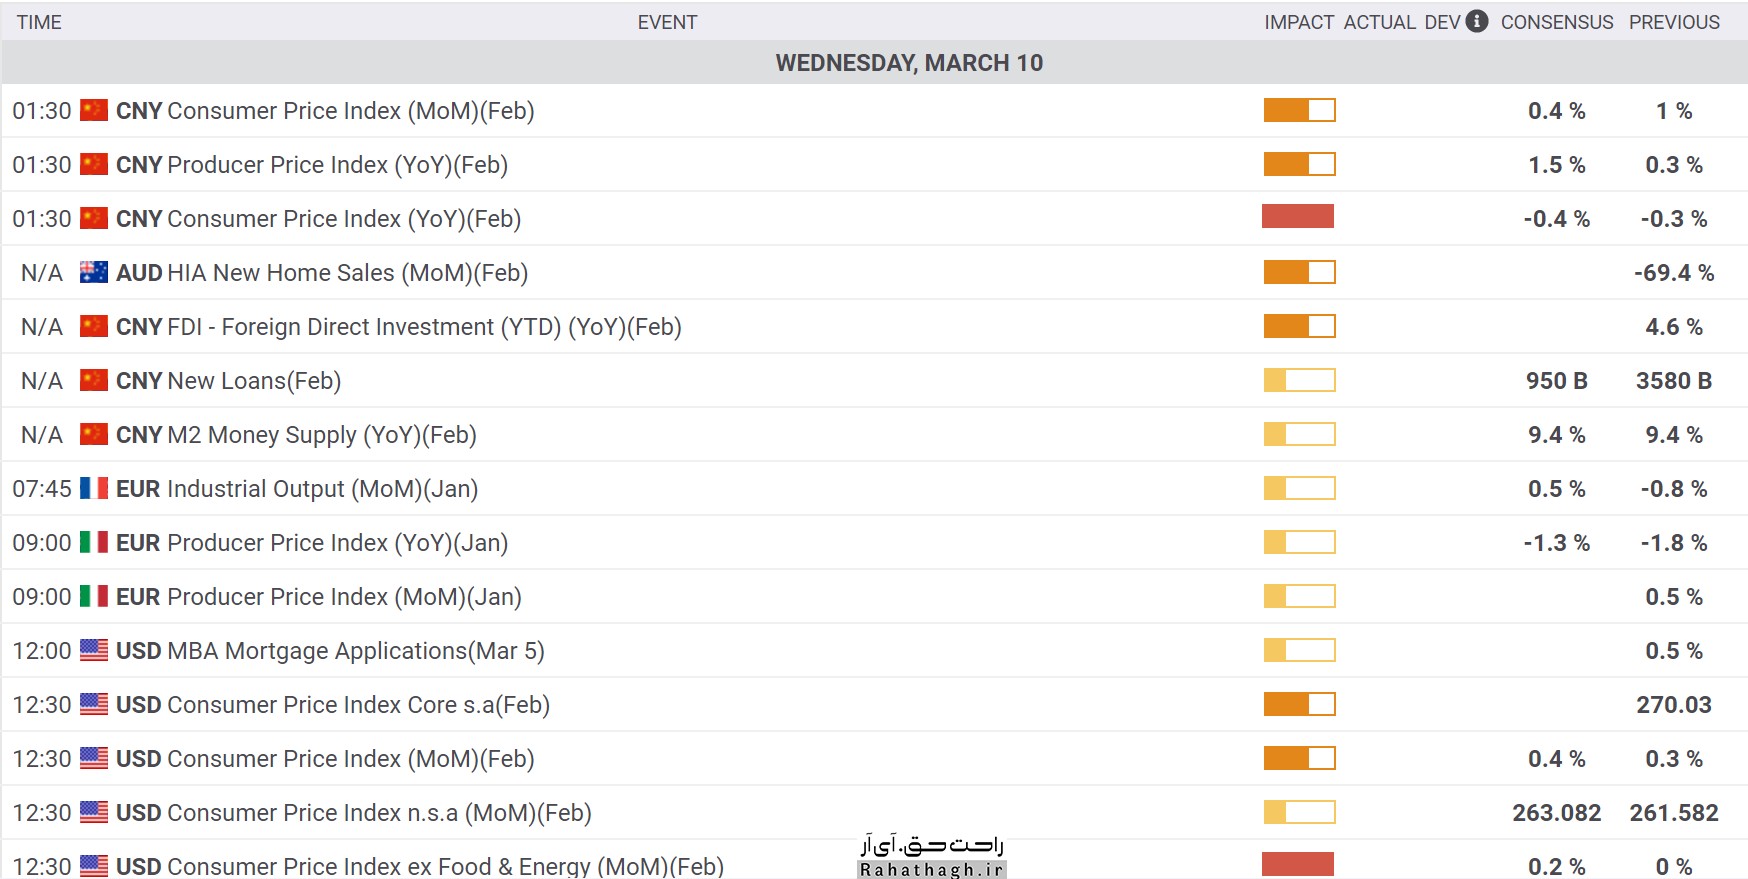
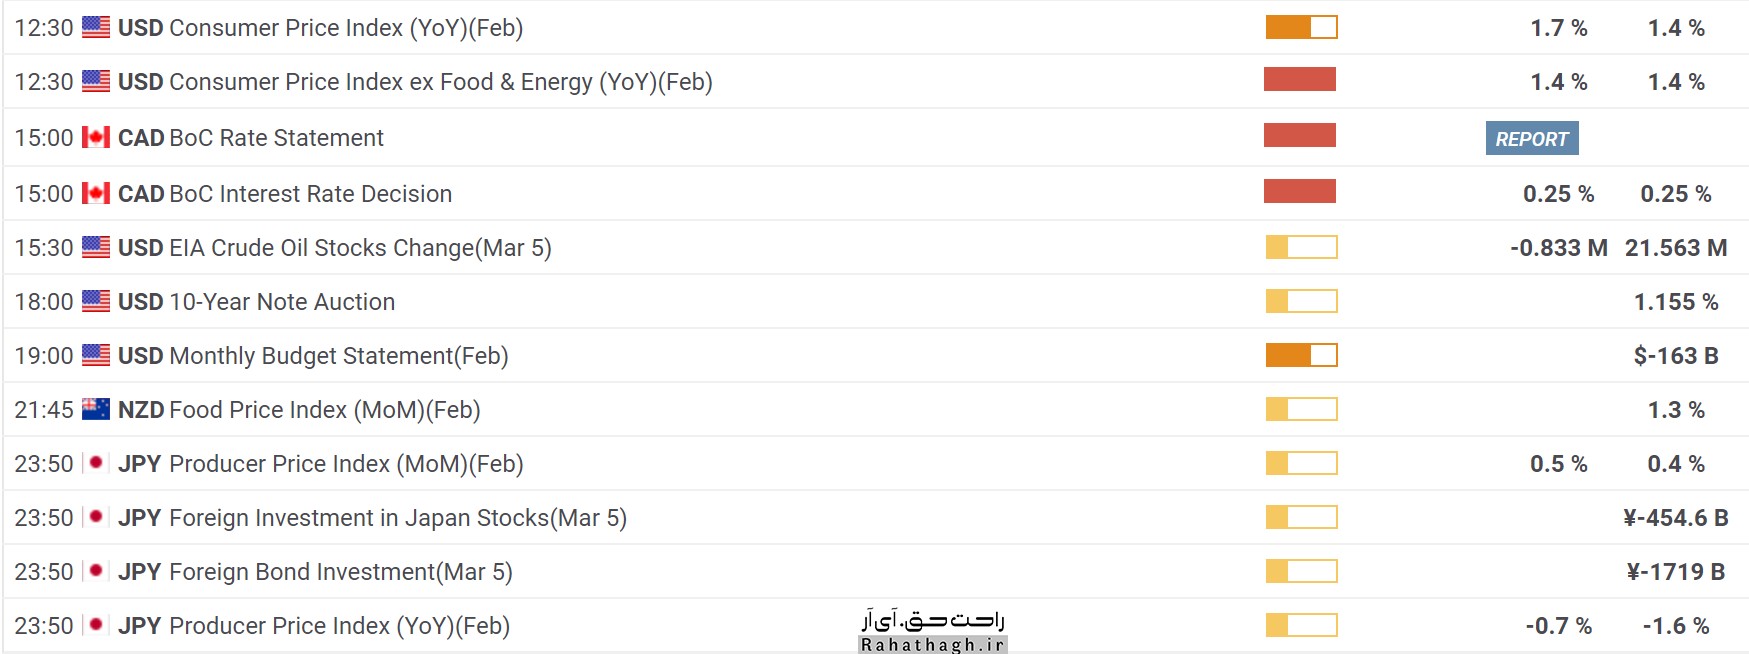
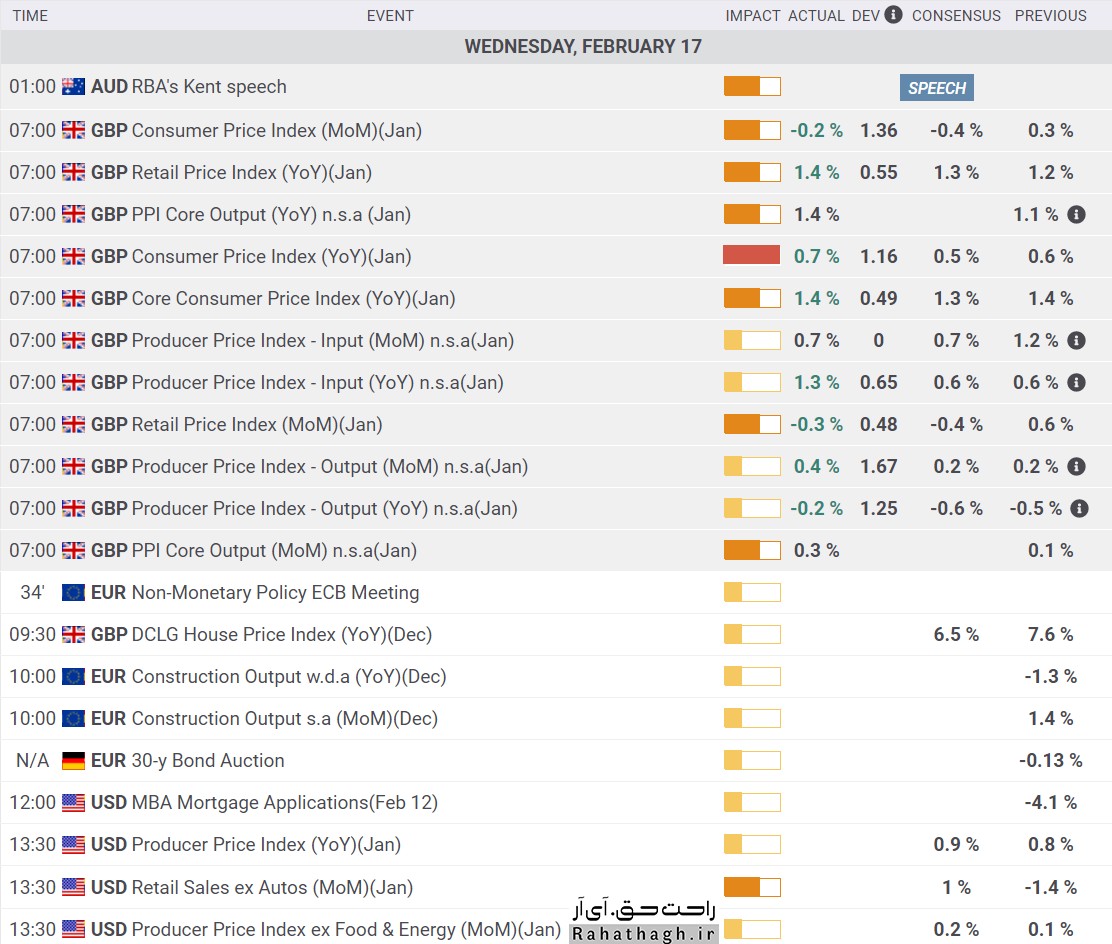
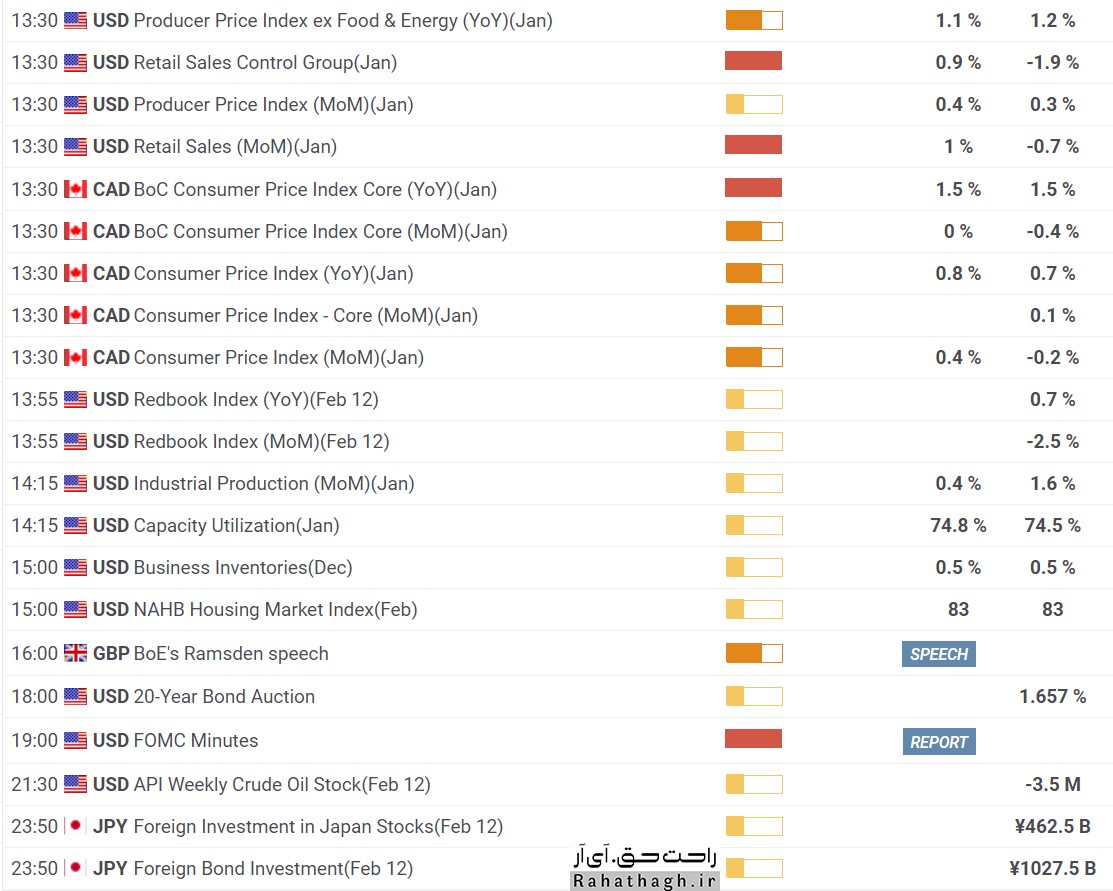 تقویم اقتصادی فارکس امروز