
GOLD Tuesday, January 26
The weekly ounce chart of global gold can bring buyers into the market due to the recent reversal and uptrend. It should also be noted that the weekly chart shows support at $ 1787 and $ 1738 and resistance at $ 1950.
In the XAUUSD daily chart, the market has also reacted positively to the simple moving average of 200 days. Aside from the 1959 high in early January, buyers should also consider the key resistance of $ 1966. Also below the 200-day moving average, $ 1746 support is below the 100% Fibonacci estimate (1756), the 50% Fibonacci retracement at 1762 and the 127.2% Fibonacci estimate at $ 1740.
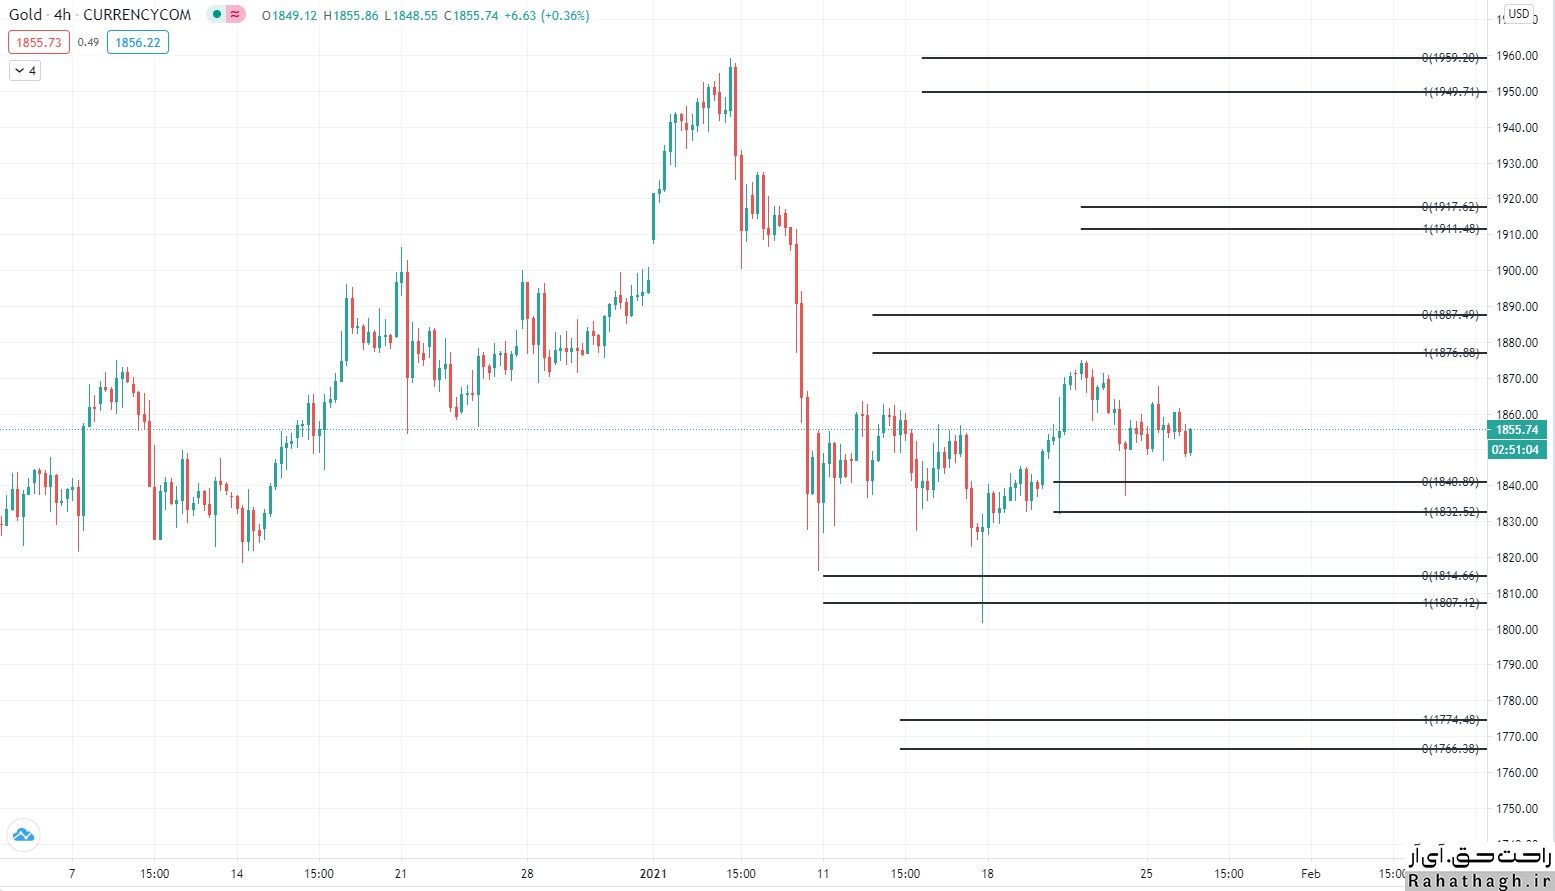
In the four-hour chart, XAUUSD may push market buyers to the November reopening rate of $ 1878. However, if the global ounce of gold falls, it will fall to the support of $ 1822. At the same time, the four-hour AB = CD pattern is completed around $ 1920 and $ 1910, which can bring sellers to market. Although this pattern could lower the price of an ounce of global gold, given the state of long-term charts, the likelihood of a drop in gold prices will be limited.
