صفحه اصلی تقویم اقتصادی تحلیل رمزارزها (Cryptocurrency) تحلیل طلا (Gold) تحلیل فارکس (Forex) ارتباط با من درباره من
ripple analysis :: سایت تحلیل بورس، فارکس و ارز دیجیتال حمید راحت حق| Rahathagh.ir

اخبار و تحلیل نموداری و تکنیکالی بازارهای مالی دنیا اعم از بازار بورس داخلی، بازار فارکس، بازار طلا و بازار ارز دیجیتال و رمزارزها و روانشناسی بازار

۳ مطلب با کلمه‌ی کلیدی «ripple analysis» ثبت شده است

Ripple Analysis (XRP) Saturday, April 3

Ripple Analysis (XRP) Saturday, April 3

https://s16.picofile.com/file/8429506934/ripple4_3_%D8%B1%D8%A7%D8%AD%D8%AA_%D8%AD%D9%82.jpg
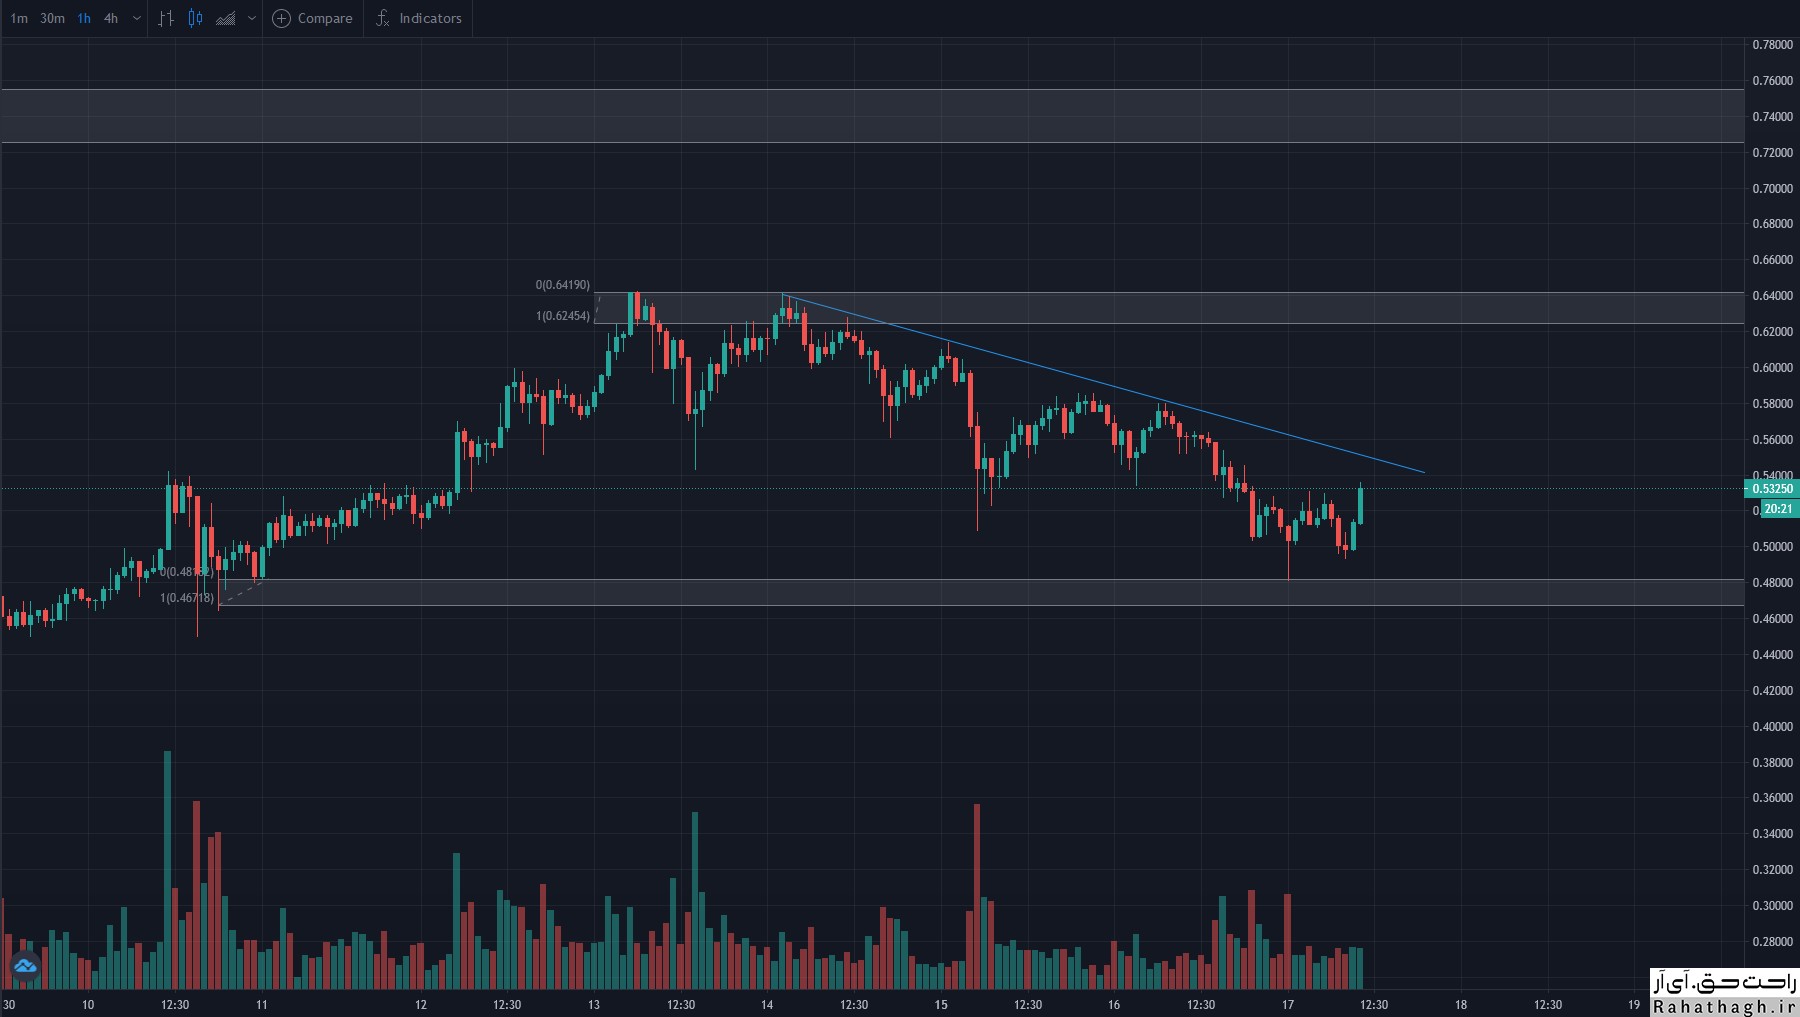
The price of Ripple Digital Currency is about to break an important resistance level and turn this level into a support. This move could signal the beginning of a strong uptrend.
Ripple prices have been inverted since late November. This pattern is a reversal pattern and reflects price growth in the long run.
This pattern consists of three valleys, one of which is lower than the others and the other valleys include the shoulder part of this pattern.
If the neckline of this pattern breaks at $ 0.63 and the price stabilizes above this level, the next target will be $ 1.09.
Ripple prices are approaching this level but have not yet closed above this resistance.

On the other hand, since January, the number of addresses holding 100,000 to 1 million ripples and 1 million to 10 million of these digital values ​​has increased by 6.17% and 5.85%, respectively. This indicates that investors are optimistic about the future of Ripple.

However, the MVRV index shows a figure of 14%, which means that many of the user accounts that maintain Ripple are not profitable and their investors are reluctant to exit the market any time soon and sell their assets.
The one-month MVRV index also fluctuates in the same range, despite a 45% increase in Ripple prices.

Overall, Ripple is ready to take an uptrend, but the continuation of this trend depends on the strong presence of buyers above the resistance level of $ 0.63.
If the price does not cross the $ 0.63 resistance, then we will see a 16% drop in the price to the level of 61.8%. Fibonacci correction at $ 0.53. If the sell-off continues, the next target of the 50% Fibonacci level will be $ 0.46. If this support level is broken, the reverse of the reverse head and shoulder pattern will be lost and the ready-to-fall price will increase.

۱۴ فروردين ۰۰ ، ۱۸:۴۲
حمید راحت حق

An overview of the cryptocurrency market Monday, February 22

An overview of the cryptocurrency market  Monday, February 22

https://bayanbox.ir/view/74315038579451079/hit-22-2-%D8%B1%D8%A7%D8%AD%D8%AA-%D8%AD%D9%82.jpg
After the last bitcoin price record of about $ 58,000, the currency returned to the $ 55,000 floor with more than $ 3,000 correction. Most replacement coins also lost some value, and Atrium fell below $ 1,900.

$ 3000 Bitcoin drop

The first cryptocurrency on the market had a very positive week, with the stock rising more than $ 12,000 in the past few days, from a record low of $ 46,000 to several consecutive records. The last record was set yesterday after BTC reached $ 58,400, which is currently the highest price level in the history of this currency.

However, the bears took action at this stage and did not allow the currency to rise further. Thus, within a few hours, Bitcoin lost more than $ 3,000 in value and reached $ 55,000.

However, BTC has recovered some of that lost value and is currently above the $ 56,000 mark.

Technical indicators show that if the price continues to improve, Bitcoin could gain more support at the levels of $ 55,000, $ 52,365 and $ 50,800. Instead, BTC must cross the $ 57,500 and $ 58,350 resistance lines before entering a new unknown territory.

Atrium below $ 1900 and Ripple jump to $ 0.60

Most large altcoins have started a correction process again in the last 24 hours. Atrium, which hit an all-time high of $ 2050 on Saturday, has lost about $ 200 since then and is currently trading below $ 1,900.

Polkadat has also seen a 2% decline in the last 24 hours. Cardano (5%), LightQueen (1%) and China Link (4%) are all red today.

Binance Quinn reached $ 280 after a 6% increase and partially offset yesterday's loss. However, Ripple rose 20 percent to above $ 0.60 and showed the best performance.
As usual, lower market value altcoins have seen more volatility. The Pundi X went green today with a 53% increase, followed by IOST (48%), Fantom (40%), Holo (35%), OKB (30%), BitTorrent (22%) and Terra (18%). ) Placed.

In contrast, Ontology has lost most of its value (-12%) since yesterday. SushiSwap (-12%), Ravencoin (-11%), Horizen (-11%), 1inch (-11%), THORChain (-10%) and Uniswap (-10%) are also in the next ranks. .

۰۴ اسفند ۹۹ ، ۱۴:۰۸
حمید راحت حق

Ripple Analysis (XRP) Wednesday, February 17

Ripple Analysis (XRP)

https://bayanbox.ir/view/134946101484175358/ripple-%D8%B1%D8%A7%D8%AD%D8%AA-%D8%AD%D9%82.jpg
The price of Ripple Digital Currency is currently fluctuating in the range of $ 0.53302. The MACD and RSI indicators have also shown a downward trend.
However, the price continued its uptrend yesterday from the support range of $ 0.4880 to $ 0.4840. This level is the intersection of the 100 moving average indicator in the four-hour time frame and the downtrend line formed since February 2 (February 4) until now.
Currently, the 50-day moving average indicator level at $ 0.5460 and the Sunday bearish trend line at $ 0.56 play the resistance levels.
If the resistance breaks $ 0.56, the price will rise to the monthly downward trend line at $ 0.06150.
On the other hand, if the price penetrates below the support level of $ 0.4880 to $ 0.4840, one can expect the price to fall to $ 0.4 and the lowest monthly level at $ 0.3405.

Technical levels
Last price of the day: $ 0.5122
Daily fluctuations: 77- Pip
Fluctuations of the day (٪): 1.48-
Starting price: $ 0.5199
Trends
20-day moving average: $ 0.4632
50-day moving average: $ 0.3473
100-day moving average: $ 0.406
200-day moving average: $ 0.333
Levels
Yesterday's highest price: $ 0.58.03
Yesterday's lowest price: $ 0.4819
Last week's highest price: $ 0.6247
Last week's lowest price: $ 0.3911
Last month's highest price: $ 0.5167
Last month's lowest price: $ 0.2109
Fibonacci 38.2. Daily: $ 0.5195
Fibonacci 61.8. Daily: $ 0.5427
Pivot S1 Daily: $ 0.4745
Pivot S2 Daily: $ 0.429
Pivot S3 Daily: $ 0.3761
Pivot R1 Daily: $ 0.5728
Pivot R2 daily: $ 0.6258
Pivot R3 Daily: $ 0.6712


Hamid Rahathagh

۲۹ بهمن ۹۹ ، ۱۱:۱۳
حمید راحت حق